πOrganic Rank Tracker
This tool enables you to track keywords ranking in organic search results on Google or Bing. You can customize tracking for desktop or mobile searches, as well as target specific locations. It also generates insightful reports, helping you compare your websiteβs performance against competitors.

New in v1.30.0: You can now access the Organic Rank Tracker Dashboard to view an overview of all your rank tracking reports in one place. This dashboard helps you quickly monitor performance across multiple domains, devices, and locations.
How to Add a Tracker
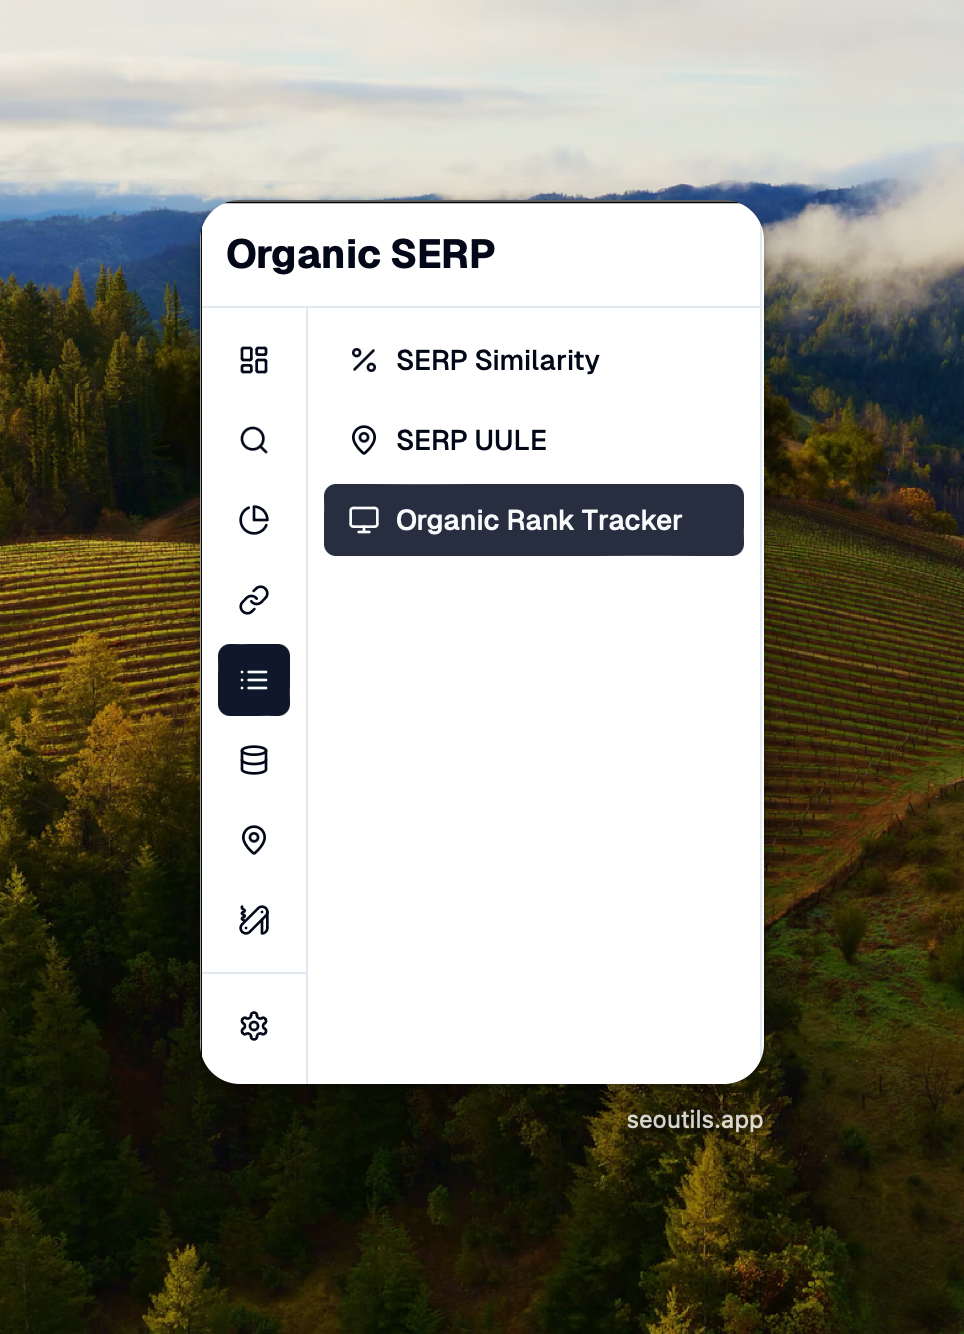
You can access the tool from the Organic SERP menu, where youβll find an βAdd Rank Trackerβ button in the top-right corner.

After clicking the button, a modal will open. Letβs walk through the fields step by step.

Basic fields
Domain: Enter the target domain here, typically your websiteβs domain.
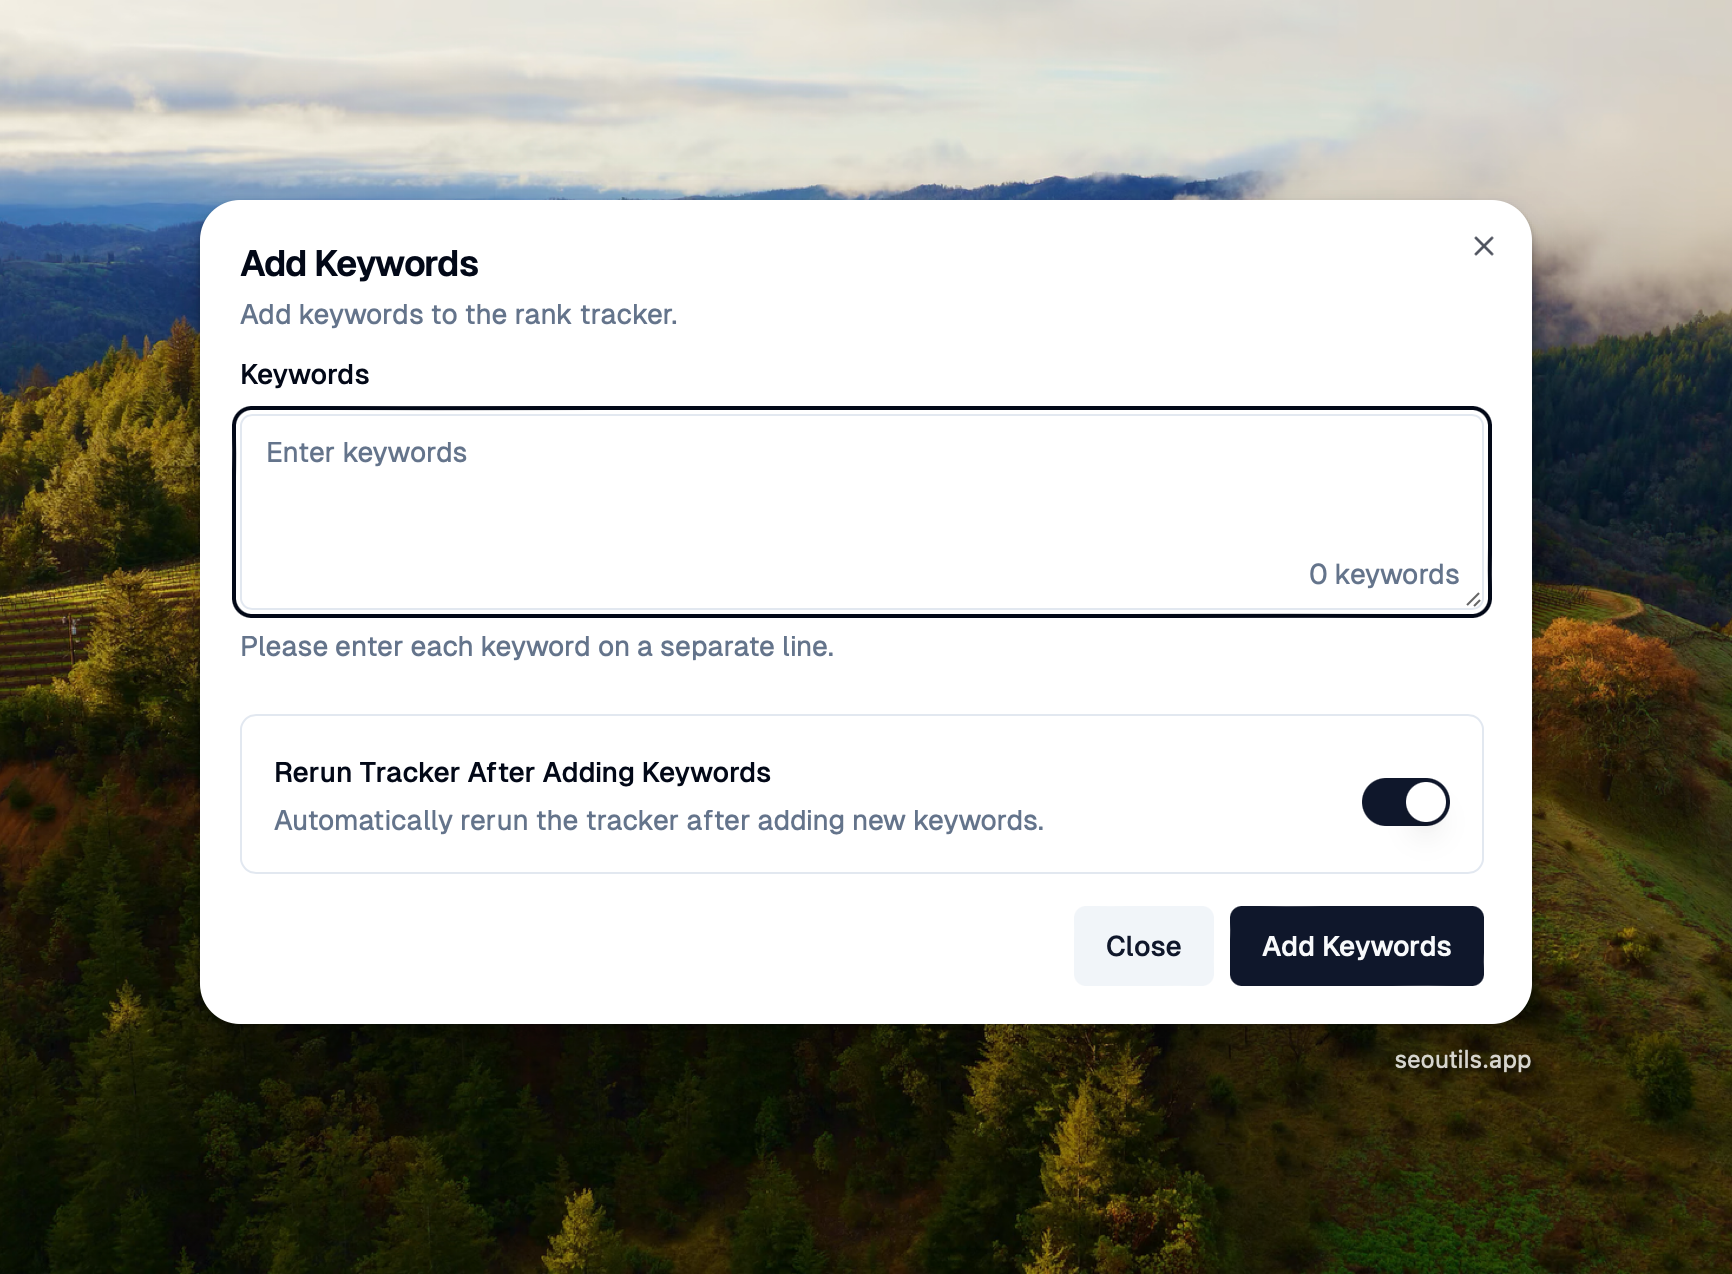
Keywords: Add a list of keywords you want to track, placing each keyword on a new line. Thereβs no limit to the number of keywords you can enter. You can add more keywords later.
Search Engine: Choose whether to track keywords on Google or Bing.
Location / Language: Select the location and language you are targeting. SEO Utils uses this selection to gather keyword metrics like CPC and search volume.
Geo Target: If youβd like to specify a more precise location, such as a city or state, enter it in this field. When a Geo Target is provided, SEO Utils will prioritize it over the selection from the Location / Language field.
Desktop Devices: Enabling this field simulates desktop devices when scraping SERP data. If disabled, SEO Utils will simulate mobile devices.
Business Name (SERP API only): When using DataForSEO or Larseo API, you can enter your business name to track its position in Google's Local Pack. This is especially valuable for local businesses, as Local Pack positions (1-3) appear prominently at the top of search results. The business name must match exactly as it appears in Google (case doesn't matter).

PAA Click Depth (DataForSEO only): Detect when your domain (or a competitor's) is featured as a source inside Google's People Also Ask box β not just whether the box appears. This is a separate visibility signal from organic ranking, and one that Semrush, Ahrefs, and SE Ranking all expose in their position trackers.
Choose how many PAA questions DataForSEO should expand to reveal source URLs:
Off (default) β PAA box presence is still detected (as a SERP feature), but no source attribution.
1β4 β DataForSEO clicks into that many PAA questions and returns each source's URL, title, and domain.

Extra DataForSEO cost: $0.00015 per click, regardless of priority. Unused clicks (PAA box absent or fewer questions than depth) are automatically refunded by DataForSEO. The cost estimate in the modal updates to reflect the new total when you change this setting.
When is this worth enabling? PAA presence is becoming an important visibility metric as Google leans more on PAA boxes for informational queries. If your content strategy includes answering specific questions, this signal tells you whether Google is citing you as a source. If you only care about the classic blue links, you can leave this off.
Track Pixels From Top (DataForSEO only): Measure the actual vertical distance β in pixels β between the top of the SERP and each result's snippet. Pure rank position is increasingly misleading because ads, AI Overviews, knowledge panels, PAA boxes, image packs, and other features push organic results down by varying amounts. Pixels From Top reflects the real on-screen visibility a result gets.
Toggle Track Pixels From Top on to enable. You can optionally override the browser dimensions DataForSEO uses to render the SERP:
Browser Width / Browser Height β viewport size in pixels. Defaults to 1920 Γ 1080 on desktop reports and 360 Γ 640 on mobile reports.
Resolution Ratio β device pixel ratio. Defaults to 1 on desktop, 3 on mobile. Range 0.5β3.
Leave any field empty to use the default β the actual numbers used are shown under each input.

Extra DataForSEO cost: $0.0006 per keyword per scrape. The cost estimate in the modal updates to reflect the new total when you toggle this on. For a 1,000-keyword tracker, that's an extra $0.60 per run.
These settings are locked once data is collected. After your first scrape with Track Pixels From Top enabled, you can no longer change the toggle, browser dimensions, or even switch the scrape method away from DataForSEO. Changing viewport mid-history would invalidate the pixel deltas across snapshots β a measurement taken at 1920Γ1080 is not comparable to one taken at 1280Γ800. If you need different settings, create a new tracker. Pick the viewport you want before you start.
When is this worth enabling? SERP layouts have changed dramatically. A result at rank #1 below a fold-filling AI Overview is far less visible than a result at rank #1 with no SERP features. Pixels From Top captures this in a single number that's directly comparable across keywords. Particularly valuable for tracking the impact of ranking improvements when SERP features are added or removed by Google.
Schedule
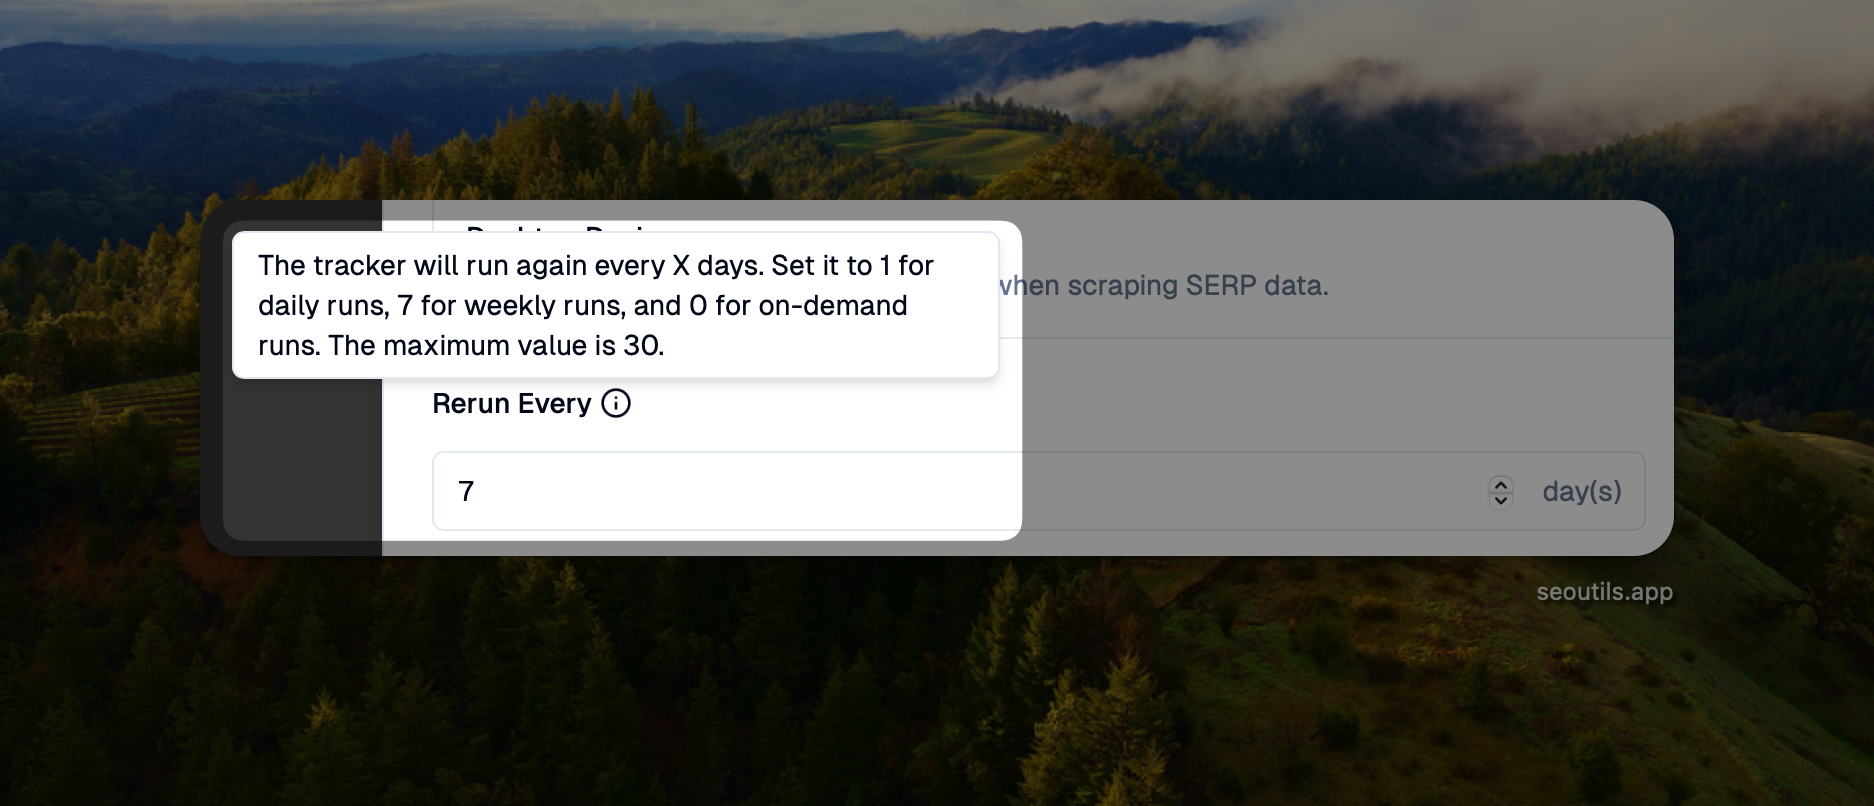
Rerun Every: Specify how often you want the tracker to run, in days. For example, set it to 1 for daily runs, 7 for weekly runs, or 0 for on-demand runs. The value can range from 0 to 30. Choose the frequency that fits your project budget and requirements.

You will need to leave the SEO Utils app open for scheduled runs to occur.
Scraping SERP methods
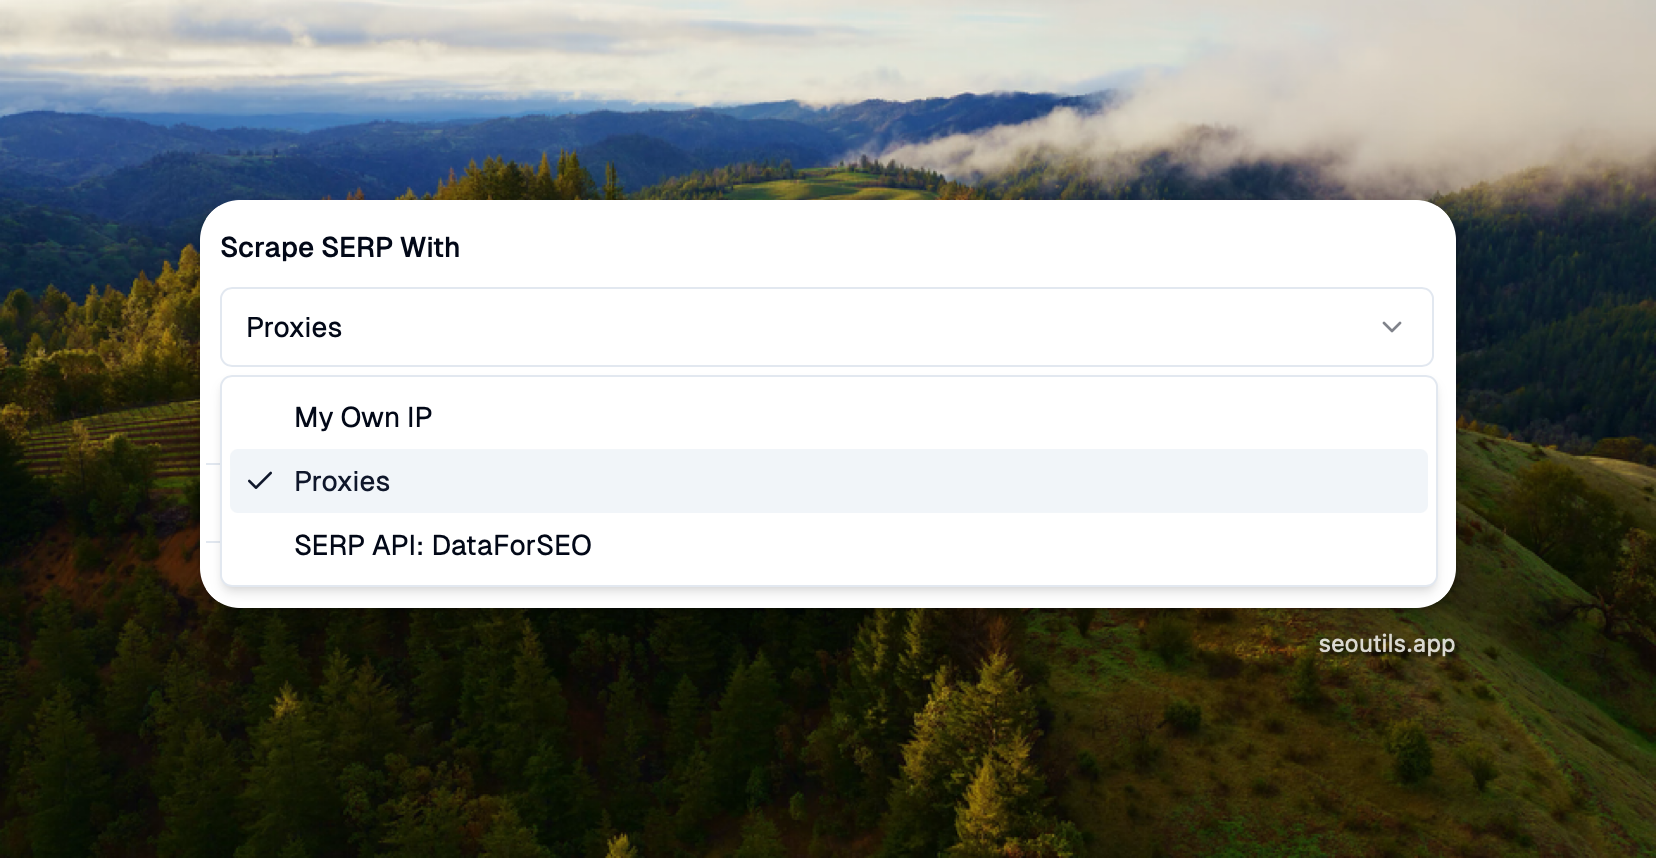
Just like the SERP Clustering tool, you can also select the method to scrape the SERP data. There are 3 options:
My Own IP: Uses your machineβs IP to scrape SERP data. This is suitable if youβre tracking only a few keywords. For larger keyword sets, consider using the Proxies or SERP API method.
Proxies: The best choice when tracking millions of keywords per month. Click here to learn how to set up a proxy.
SERP API: DataForSEO: Ideal for tracking hundreds to thousands of keywords per month. Youβll be charged an additional $0.60 per 1,000 keywords via the SERP API, with a pay-as-you-go model. Itβs affordable and easy to get started.
Important: To use the SERP API, you must have your own DataForSEO account. Renting API key services isn't viable because DataForSEO restricts certain endpoints that I utilized to implement the Queue mode. If multiple users rely on a rented API key from my account, it will slow down the process for everyone. For the quickest results, using your own DataForSEO account is the best approach.

When you choose the Proxies option, three additional fields help you scrape SERP more effectively.
Workers: Select the total number of workers to scrape SERP data. The more workers you choose, the faster the process will be, but it will also require more CPU power and proxy quality. You can enter 1-50 workers.
Request delay: Enter the number of seconds you wish to have between each request to scrape SERP data for keywords. The more delay time you set, the slower the process will be, but it will help you avoid being blocked by Google. Set '0' to scrape SERP data without any delay.
Back-off Time: Enter the number of seconds you wish to wait before retrying the failed scraping request. SEO Utils retries the request up to 3 times before skipping a keyword. The more back-off time you set, the slower the process will be, but it will help you avoid being blocked by Google. Set '0' to use the default back-off time.
My favorite setting when using rotating residential proxies is:
Workers: 10.
Request delay: 1.
Back-off time: 1 (sometimes 2 if I notice many failed requests).
Once all the fields are set up, please click the Add Tracker button.
Manage Tracker: Keywords, Competitors, Annotations, Snapshots
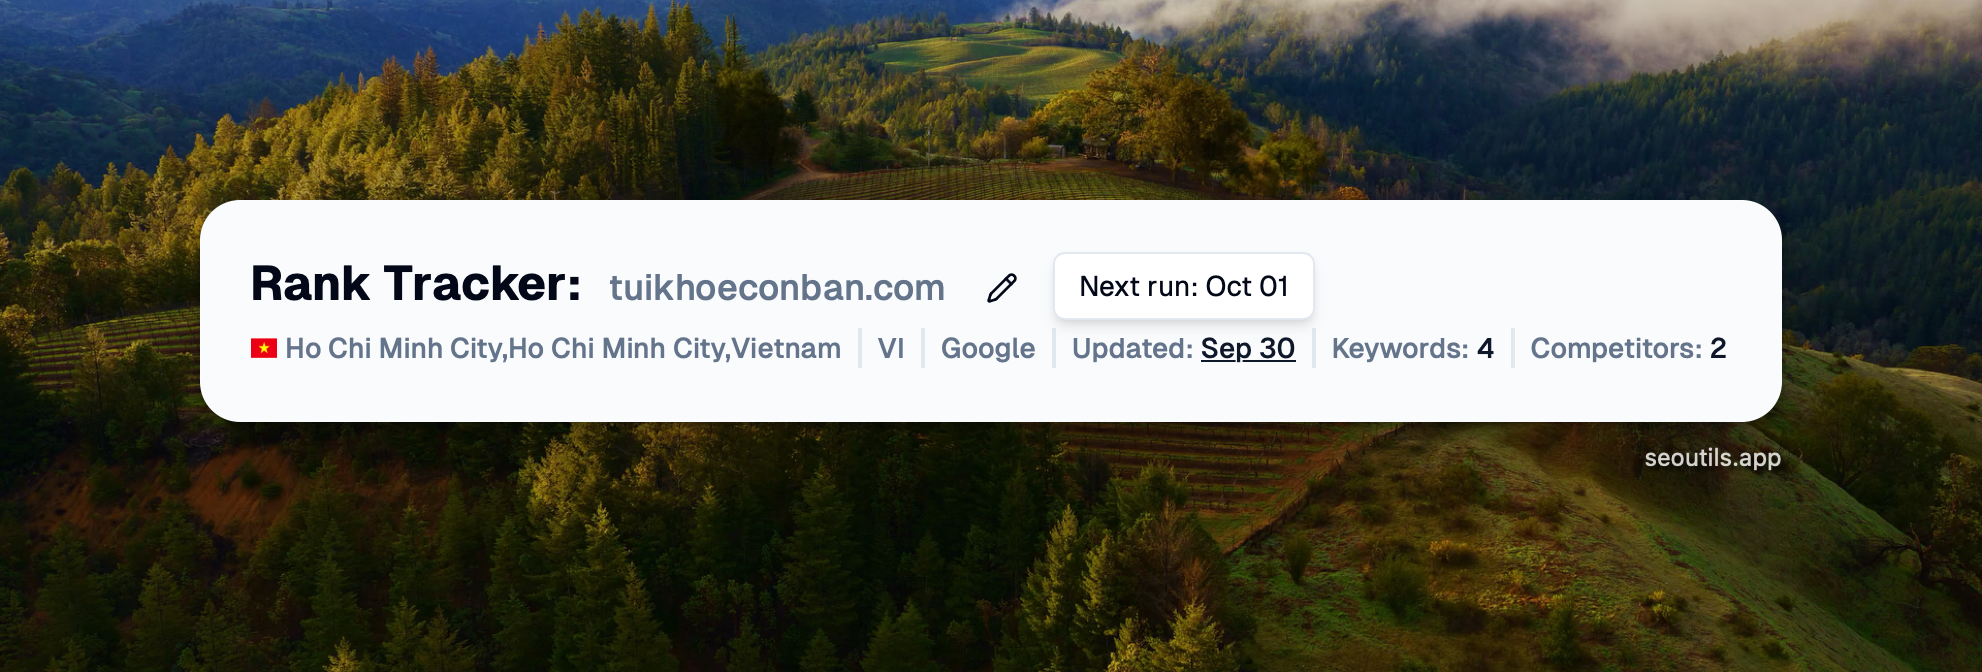
At the top of the page, you will find all the essential information about the report, including the location, language, search engine, total keywords, and competitors. You can also hover over the updated date to see when the next run is scheduled.

You can always edit the report by clicking the pencil icon button.
Manage keywords & tags
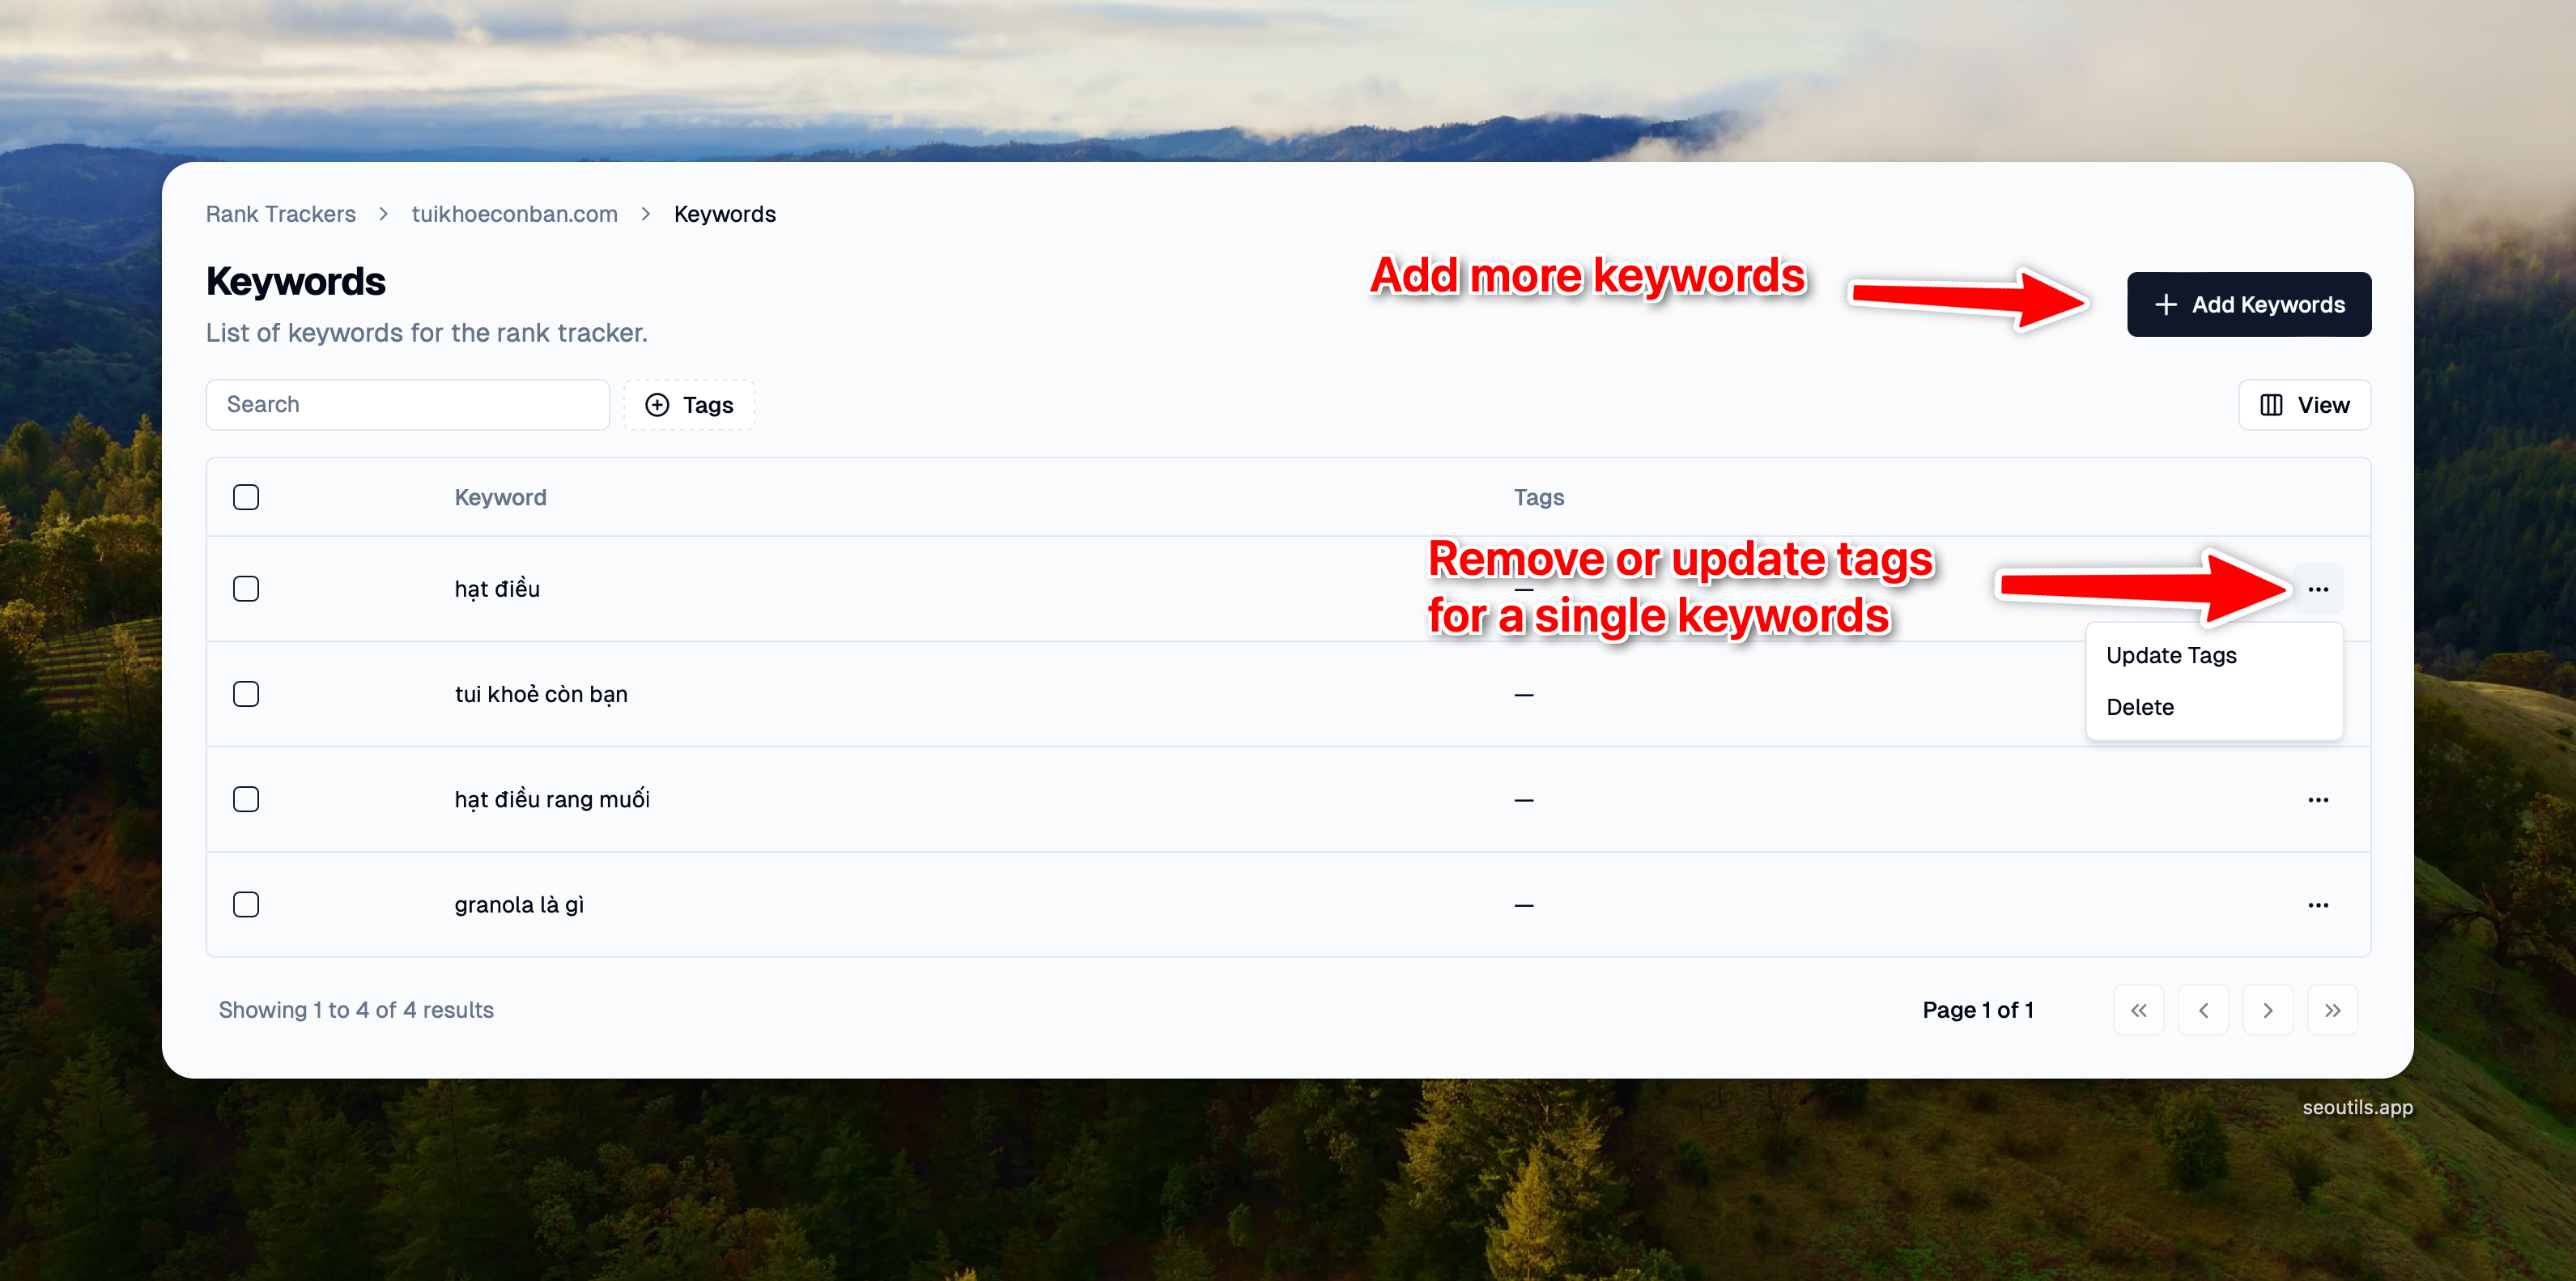
To manage your keywords, simply click on the keyword count. This will redirect you to a page where you can add or remove keywords as needed.

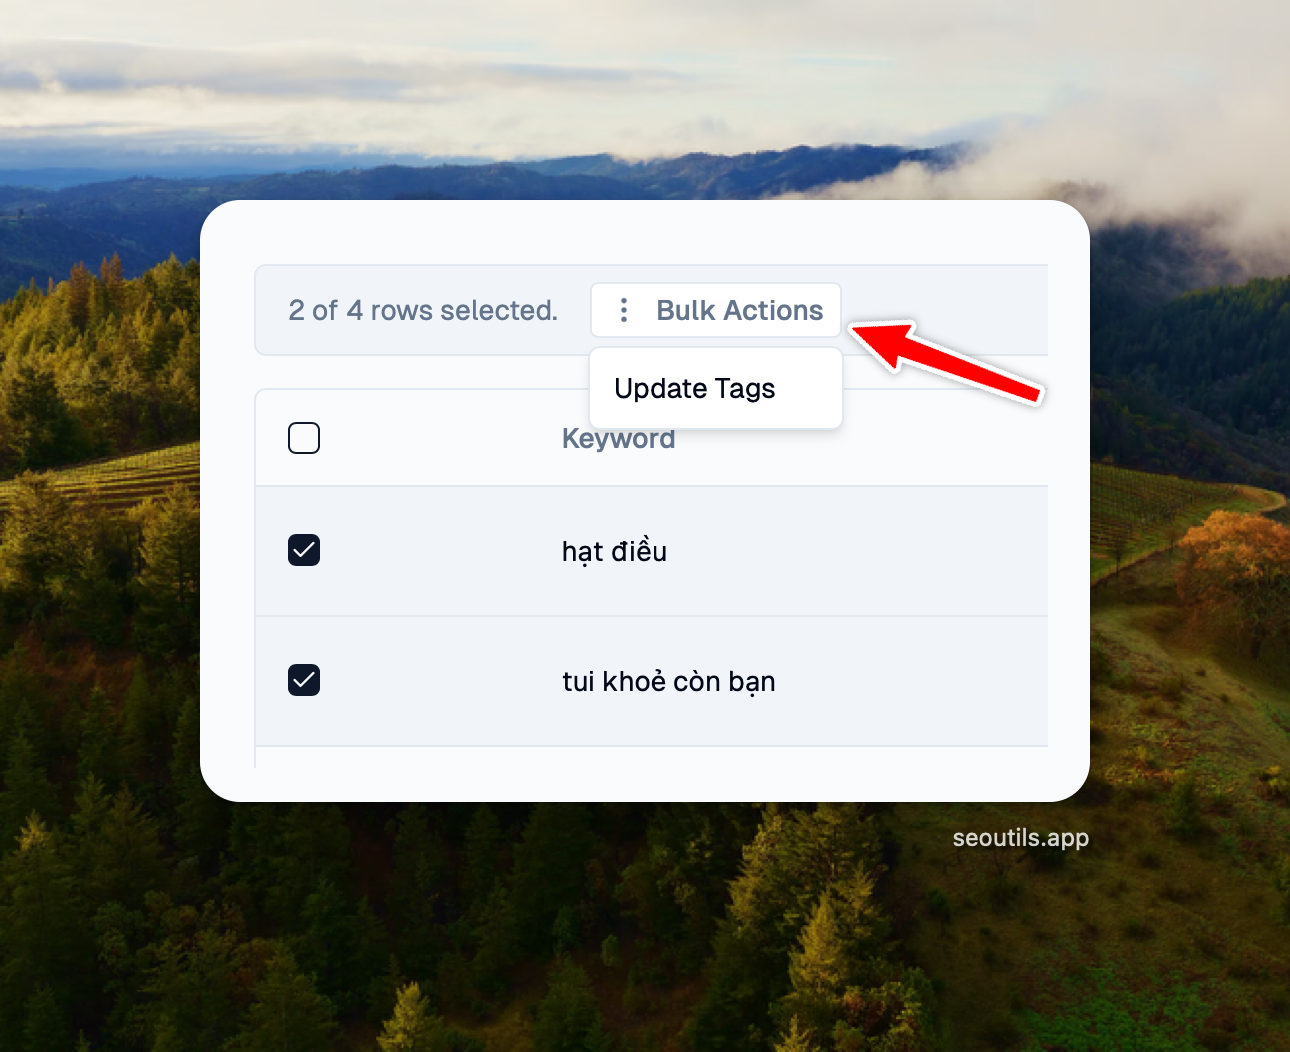
You can update tags for several keywords at once by selecting them and using the "Update Tags" bulk action.

You can instruct SEO Utils to check rankings immediately after adding keywords by toggling the βRerun Tracker After Adding Keywordsβ option. If left off, the tool will check the rankings of new keywords during the next scheduled run.

By adding tags for keywords, youβll be able to tag and filter keywords for more efficient tracking and organization.

Check Keyword Metrics & Analyze SERP Data
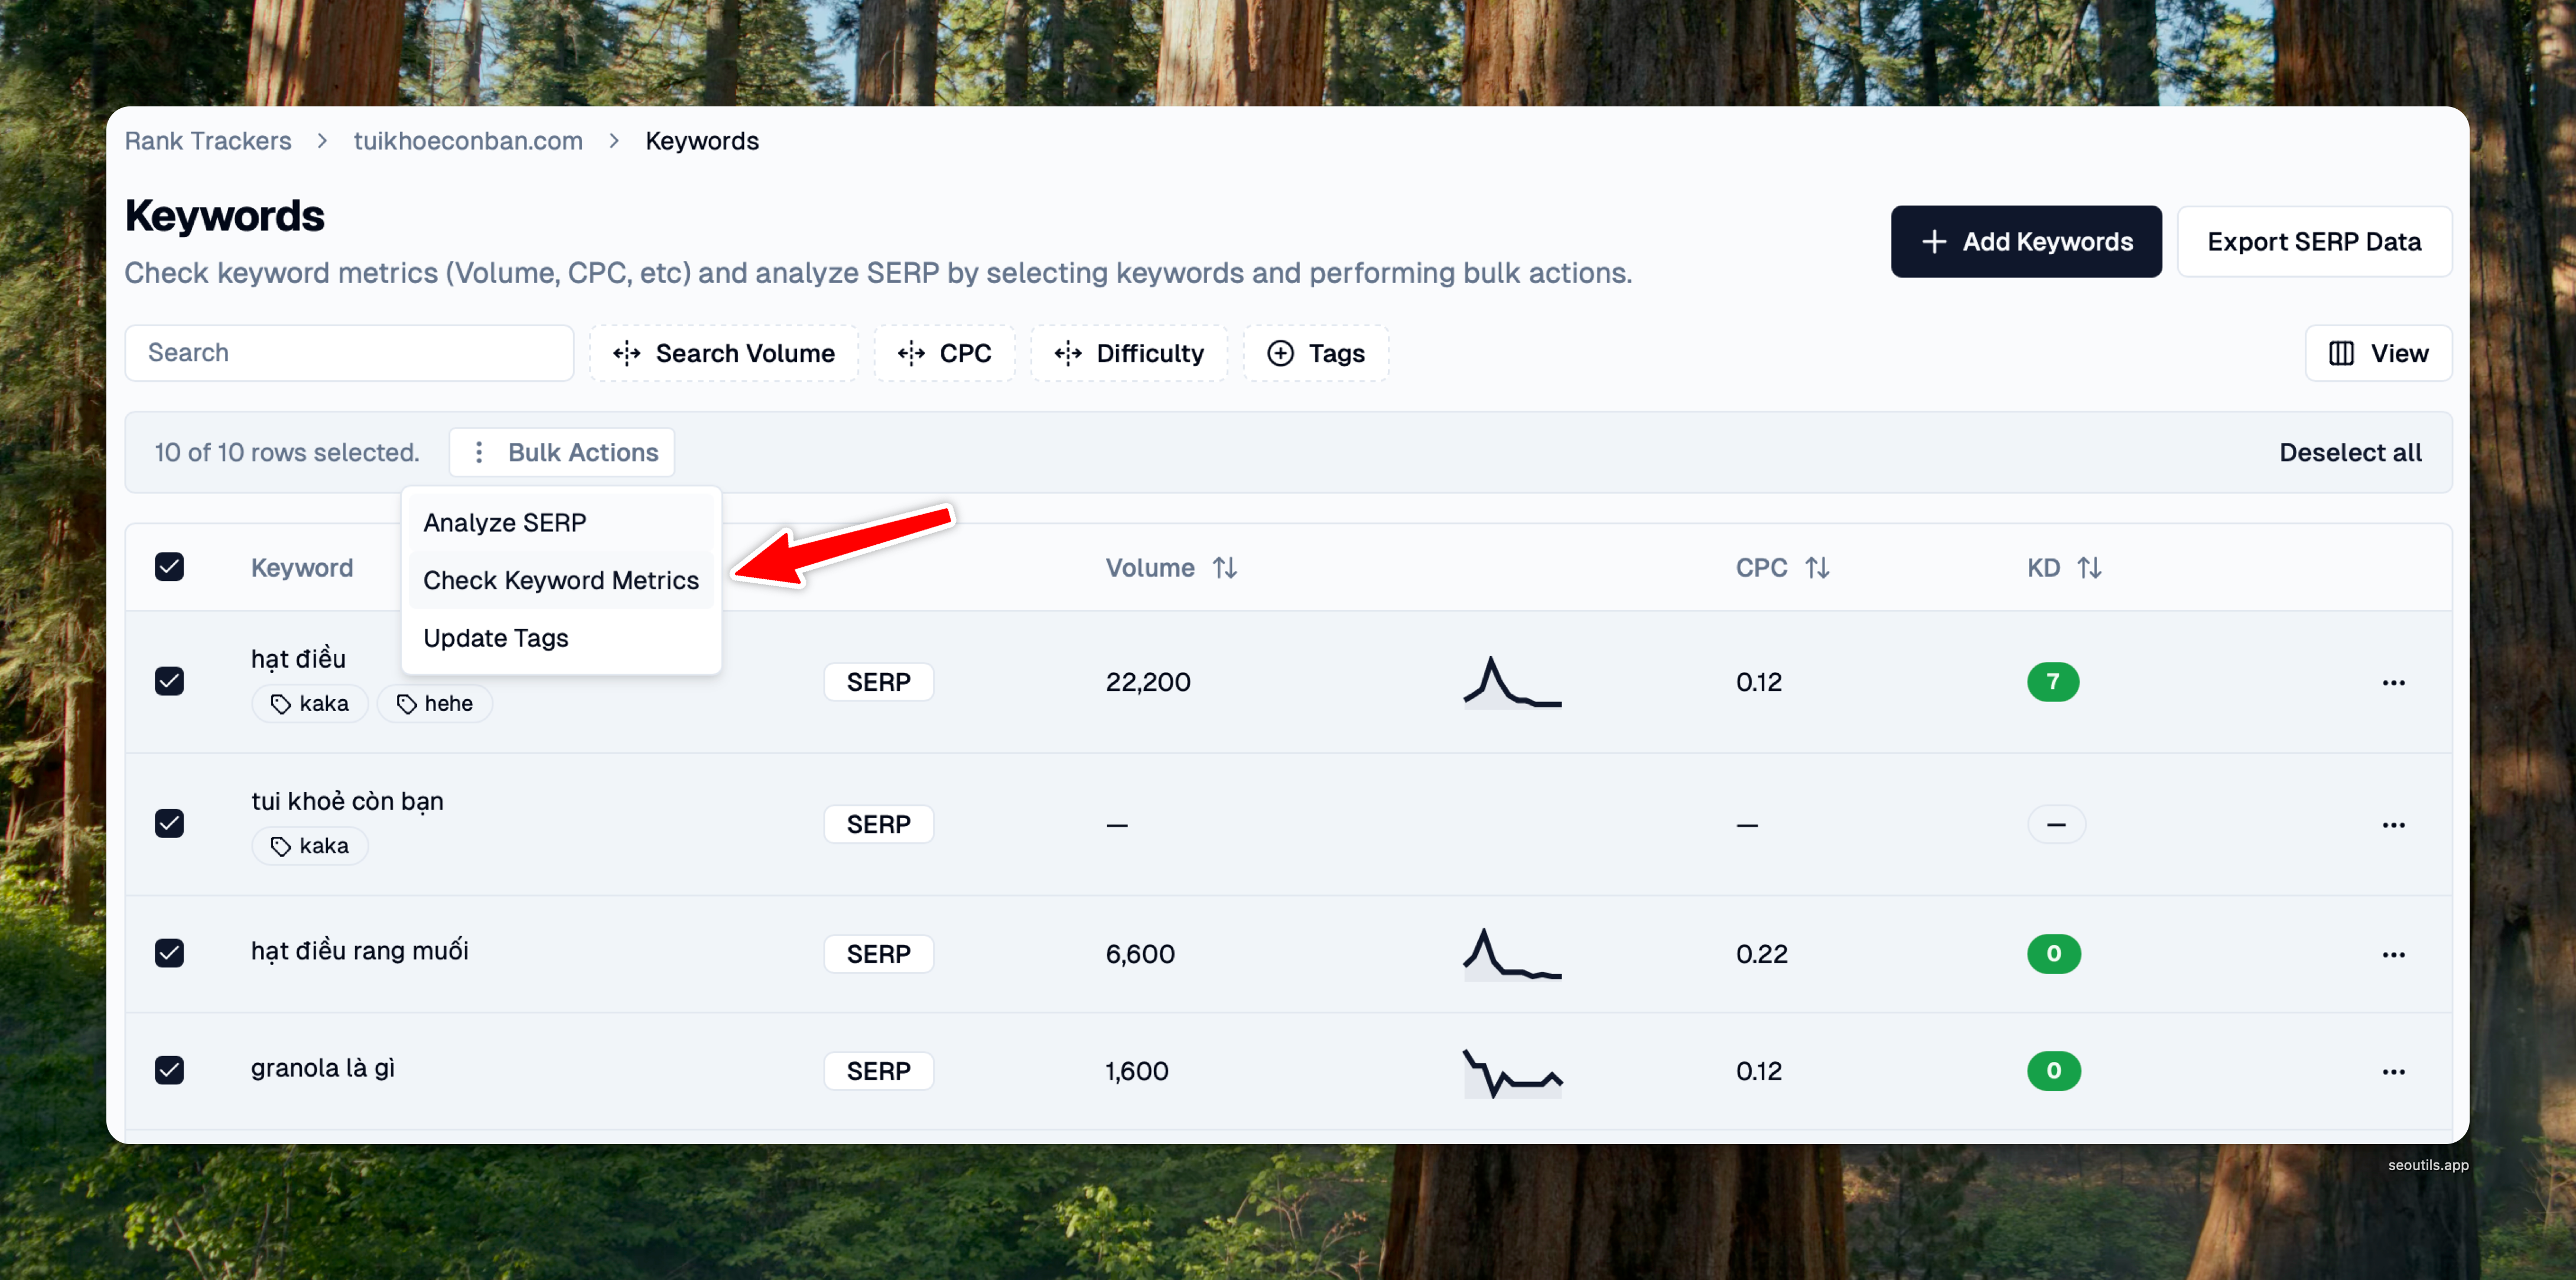
To check keyword metrics (Search Volume, CPC, KD, etc), you can simply select the keywords you want to check and run the bulk action: Check Keyword Metrics.

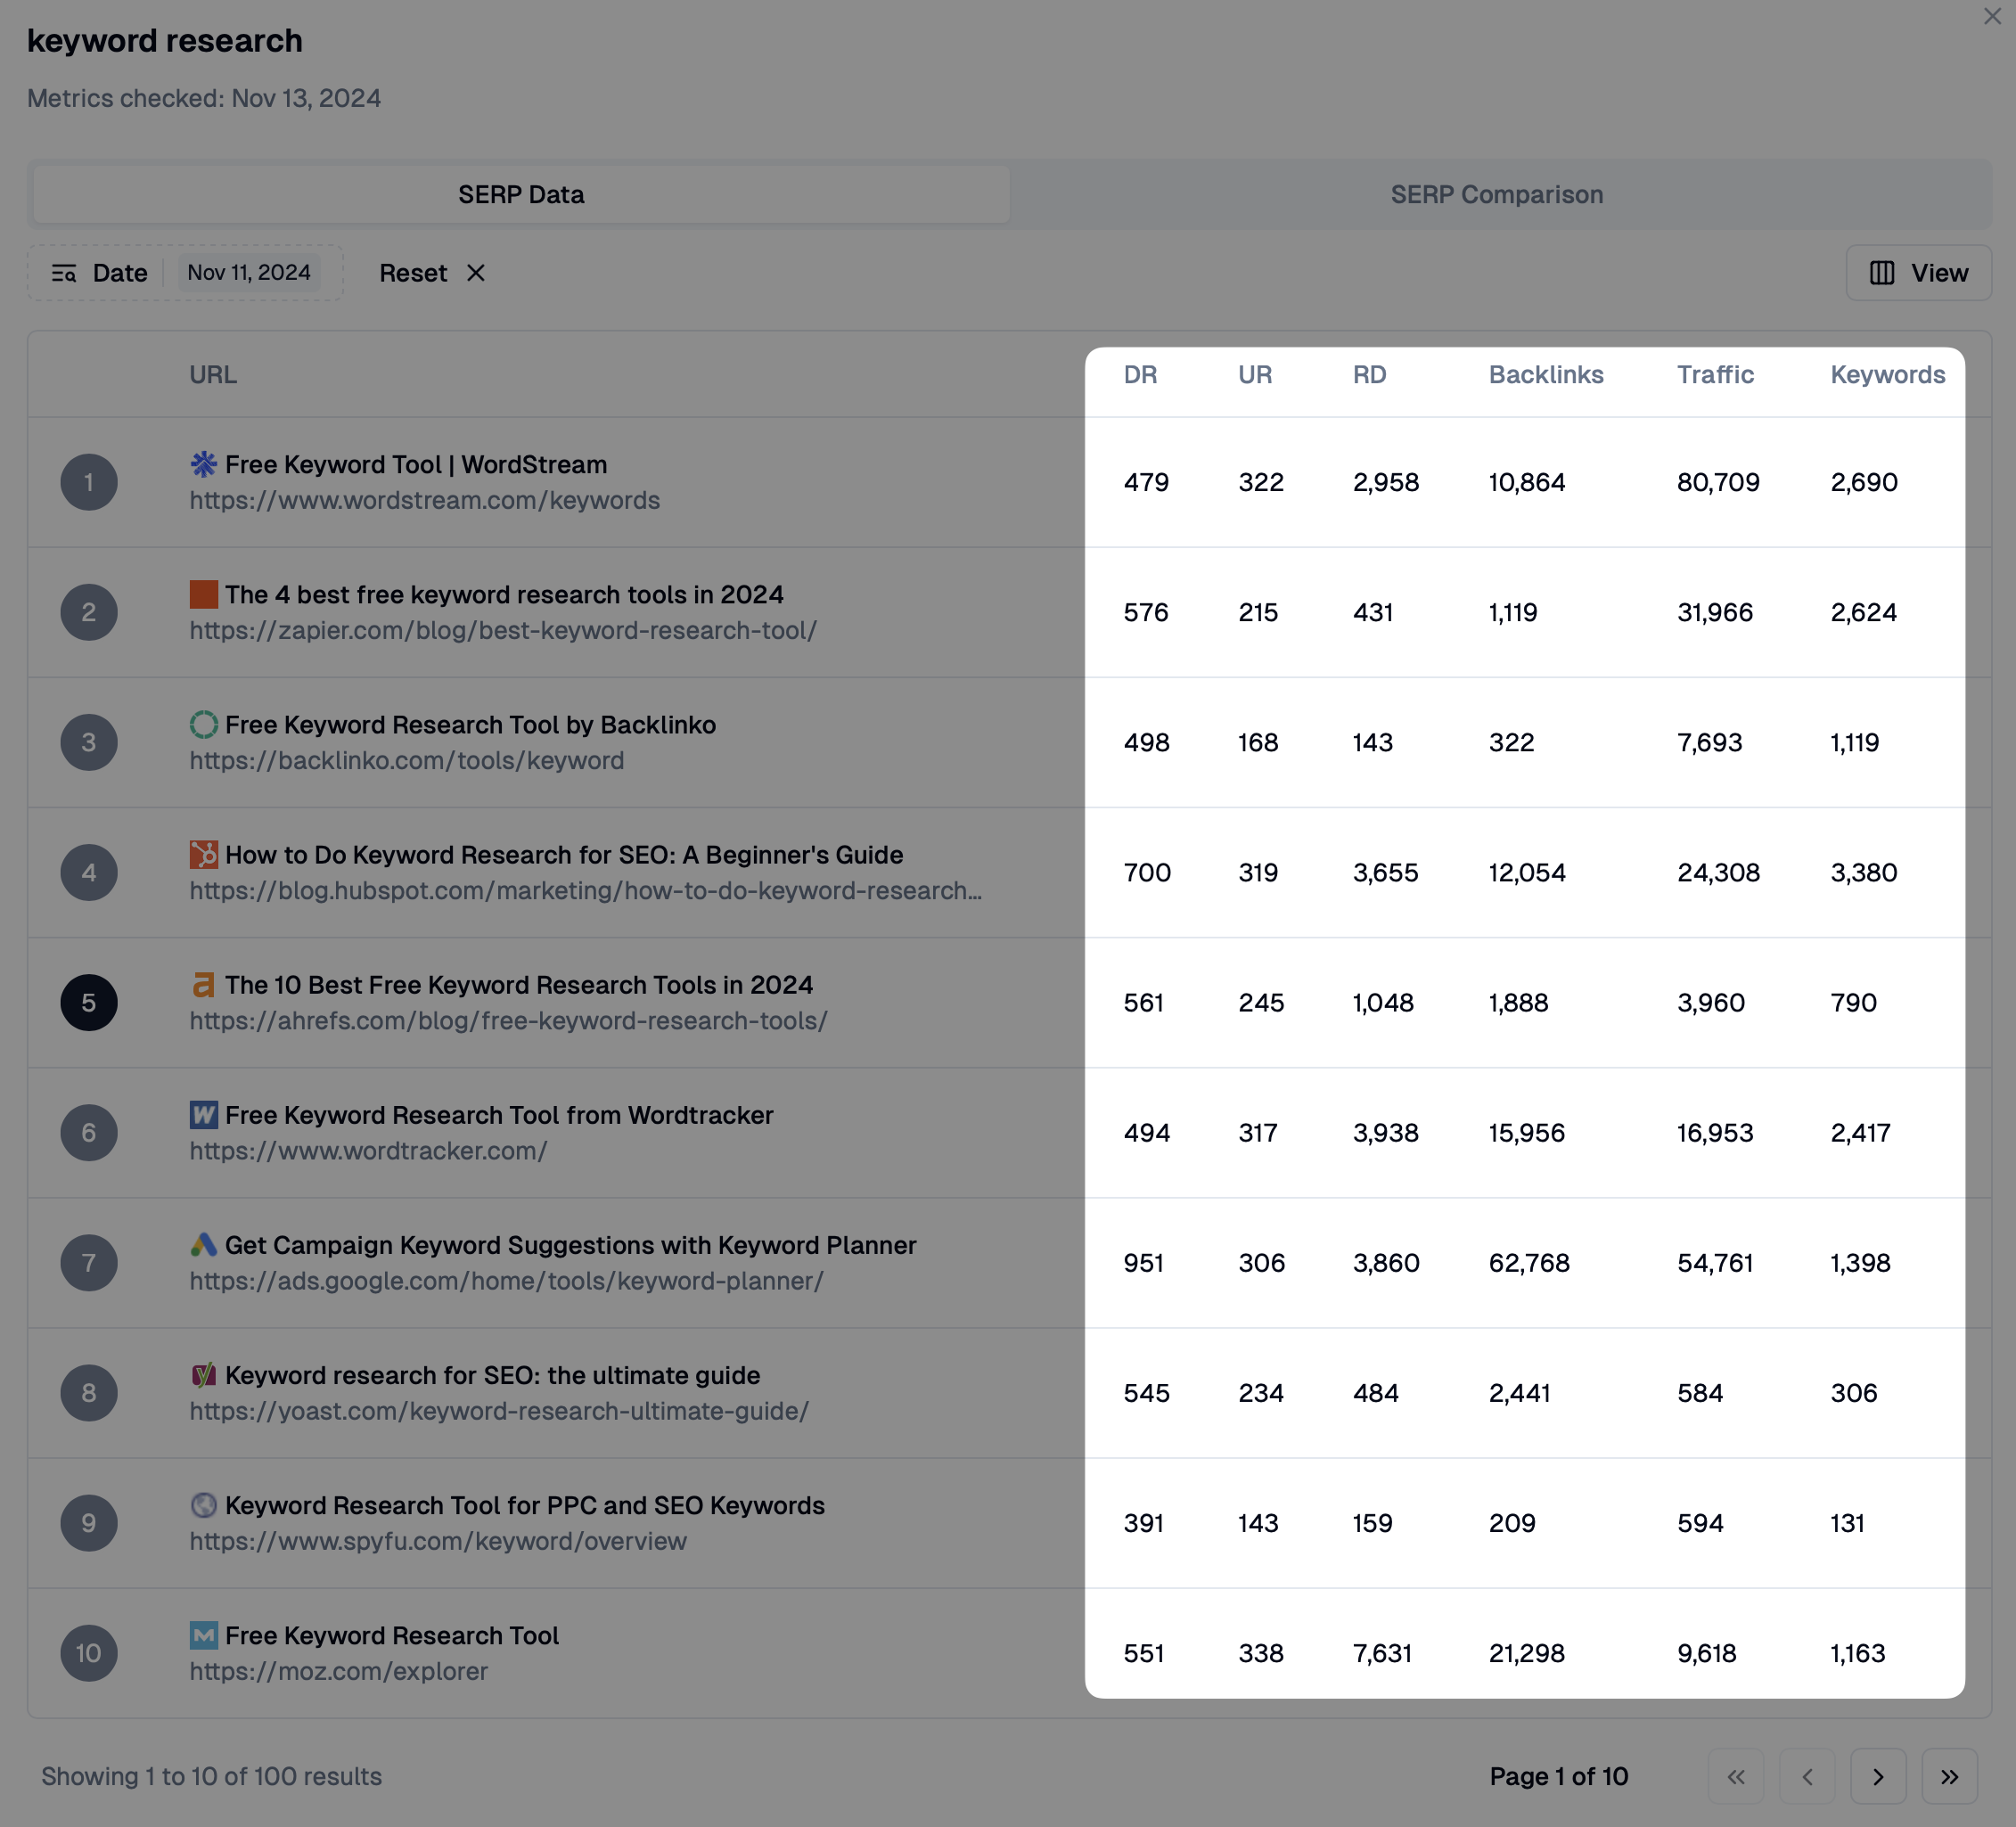
You can also click Analyze SERP bulk action, to pull valuable insights on the top 10-100 URLs, including:
Backlink count for each URL.
Total keywords each URL ranks for.
Estimated traffic each URL receives.
Domain rating (DR) and URL rating (UR) of each URL.
These insights empower you to assess competitor strengths and uncover opportunities to boost your own rankings.

You can also export SERP data of all keywords to view more metrics: Referring IPs, Referring Pages, Referring Main Domains, Broken Backlinks, etc
Map External Keyword Data
New in v1.33.4: You can now import external keyword metrics and tags from Excel or CSV files to enrich your keyword data.
The Map Keyword Data feature allows you to import external data sources to enhance your keyword tracking with:
Search Volume: Monthly search volume for keywords
CPC (Cost Per Click): Average cost per click data
KD (Keyword Difficulty): Competitive difficulty scores
Search Intents: User intent classification (informational, navigational, transactional, commercial)
Tags: Custom labels for organizing keywords
To use this feature:
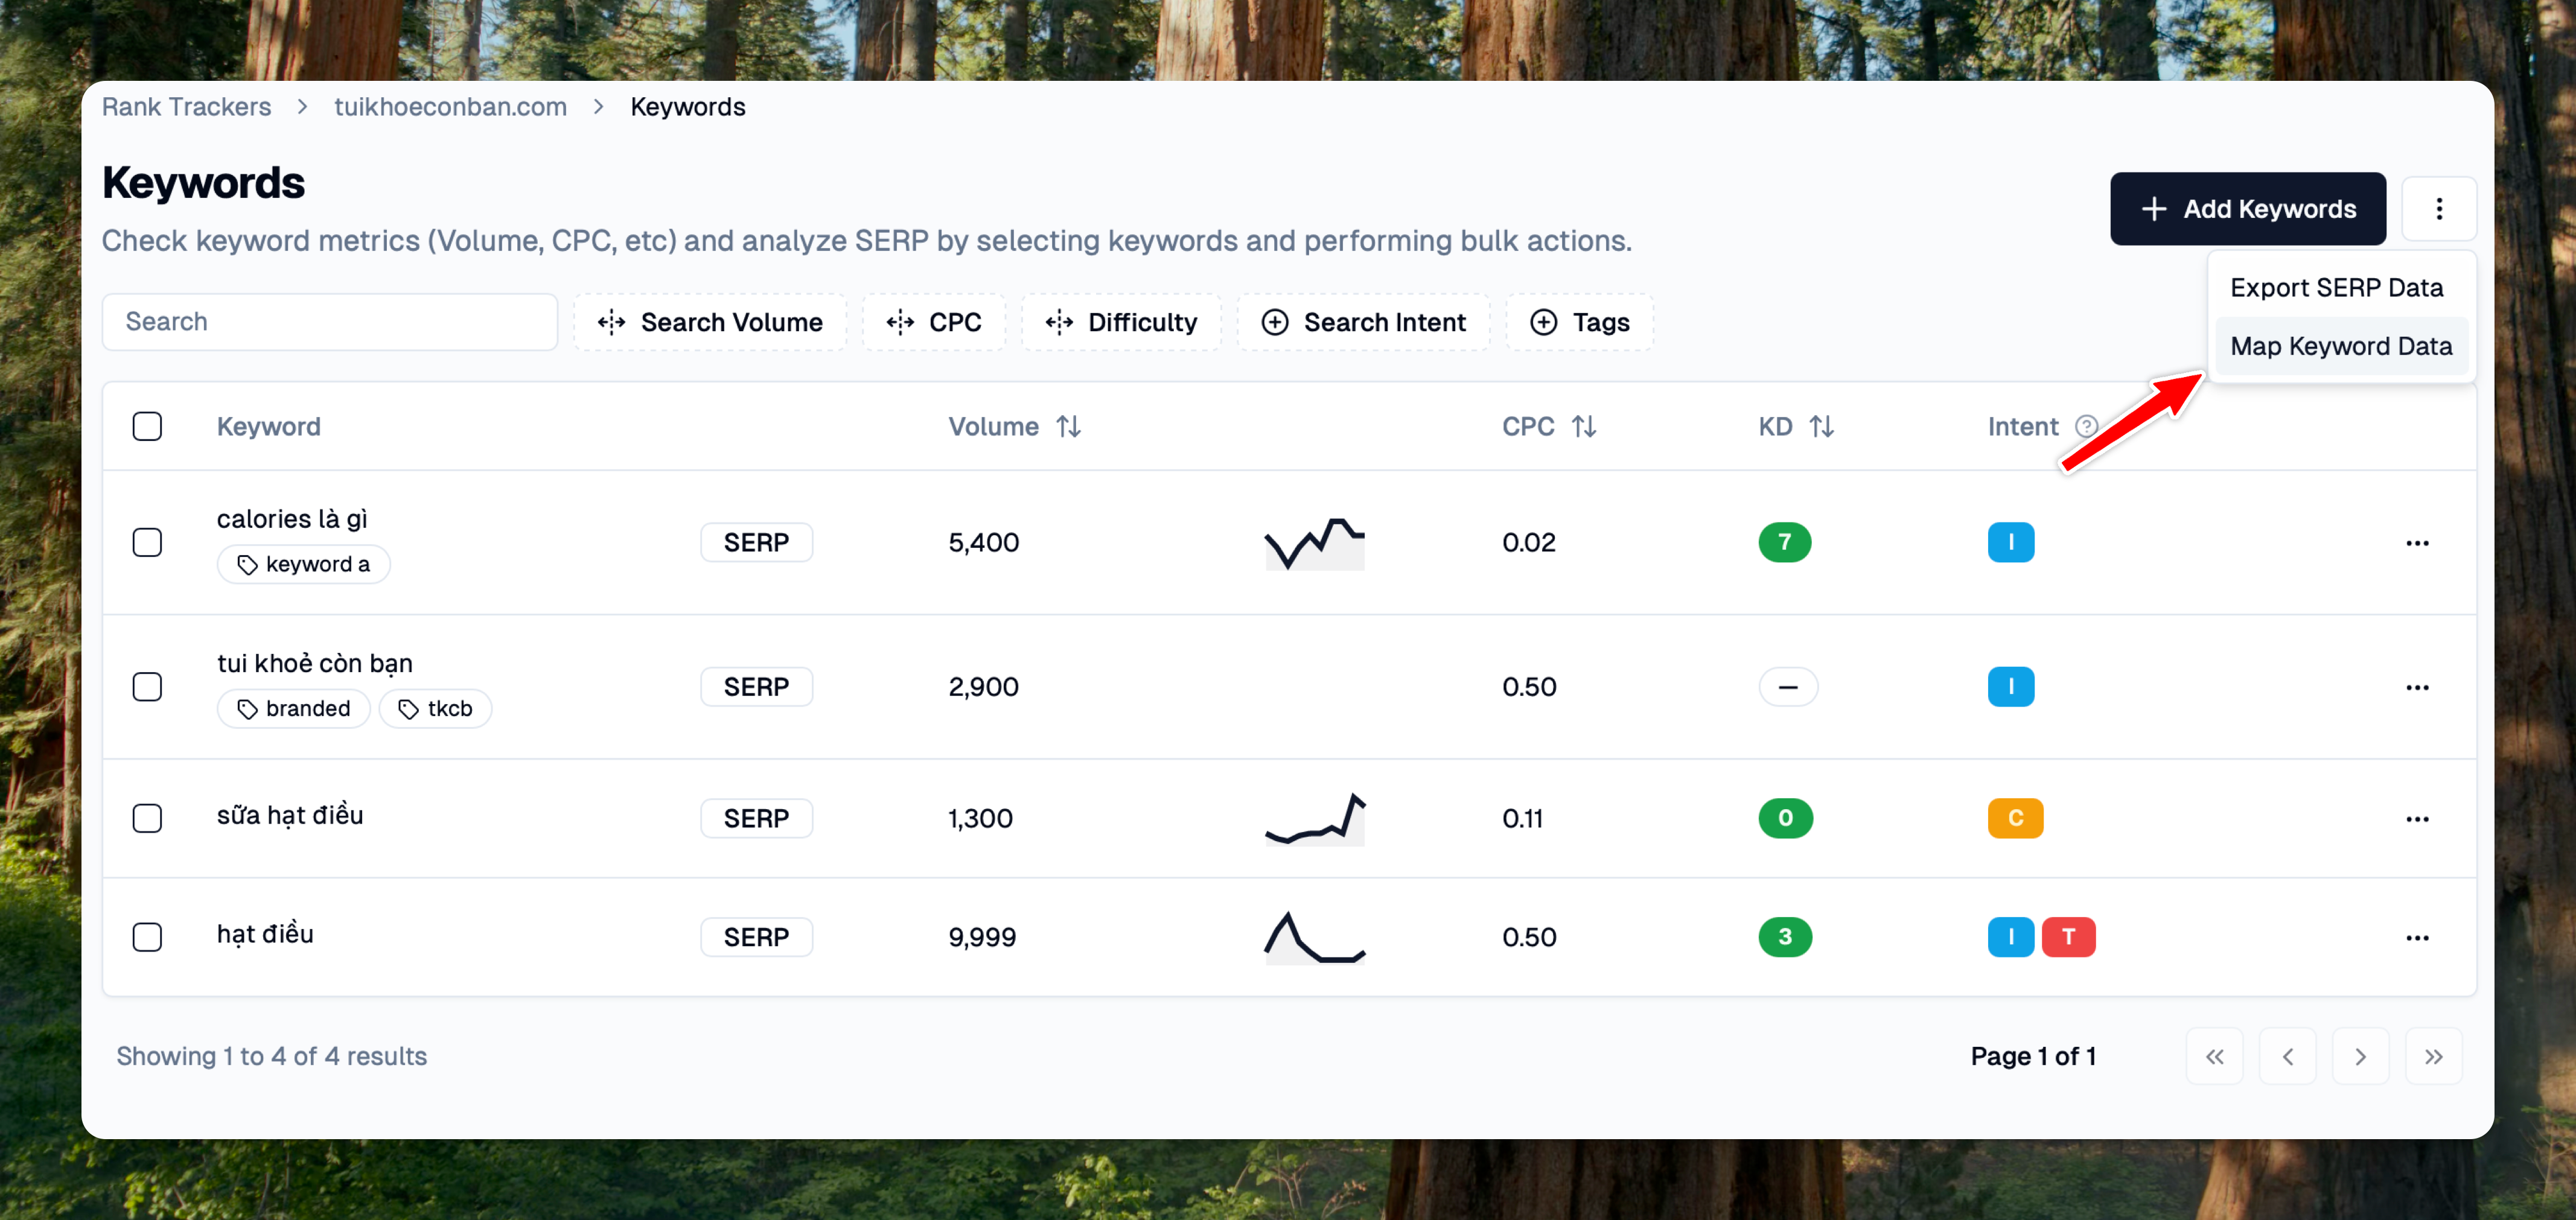
Click on the keyword count to go to the keywords management page
Click on "Map Keyword Data" from the "3 dots" action dropdown menu

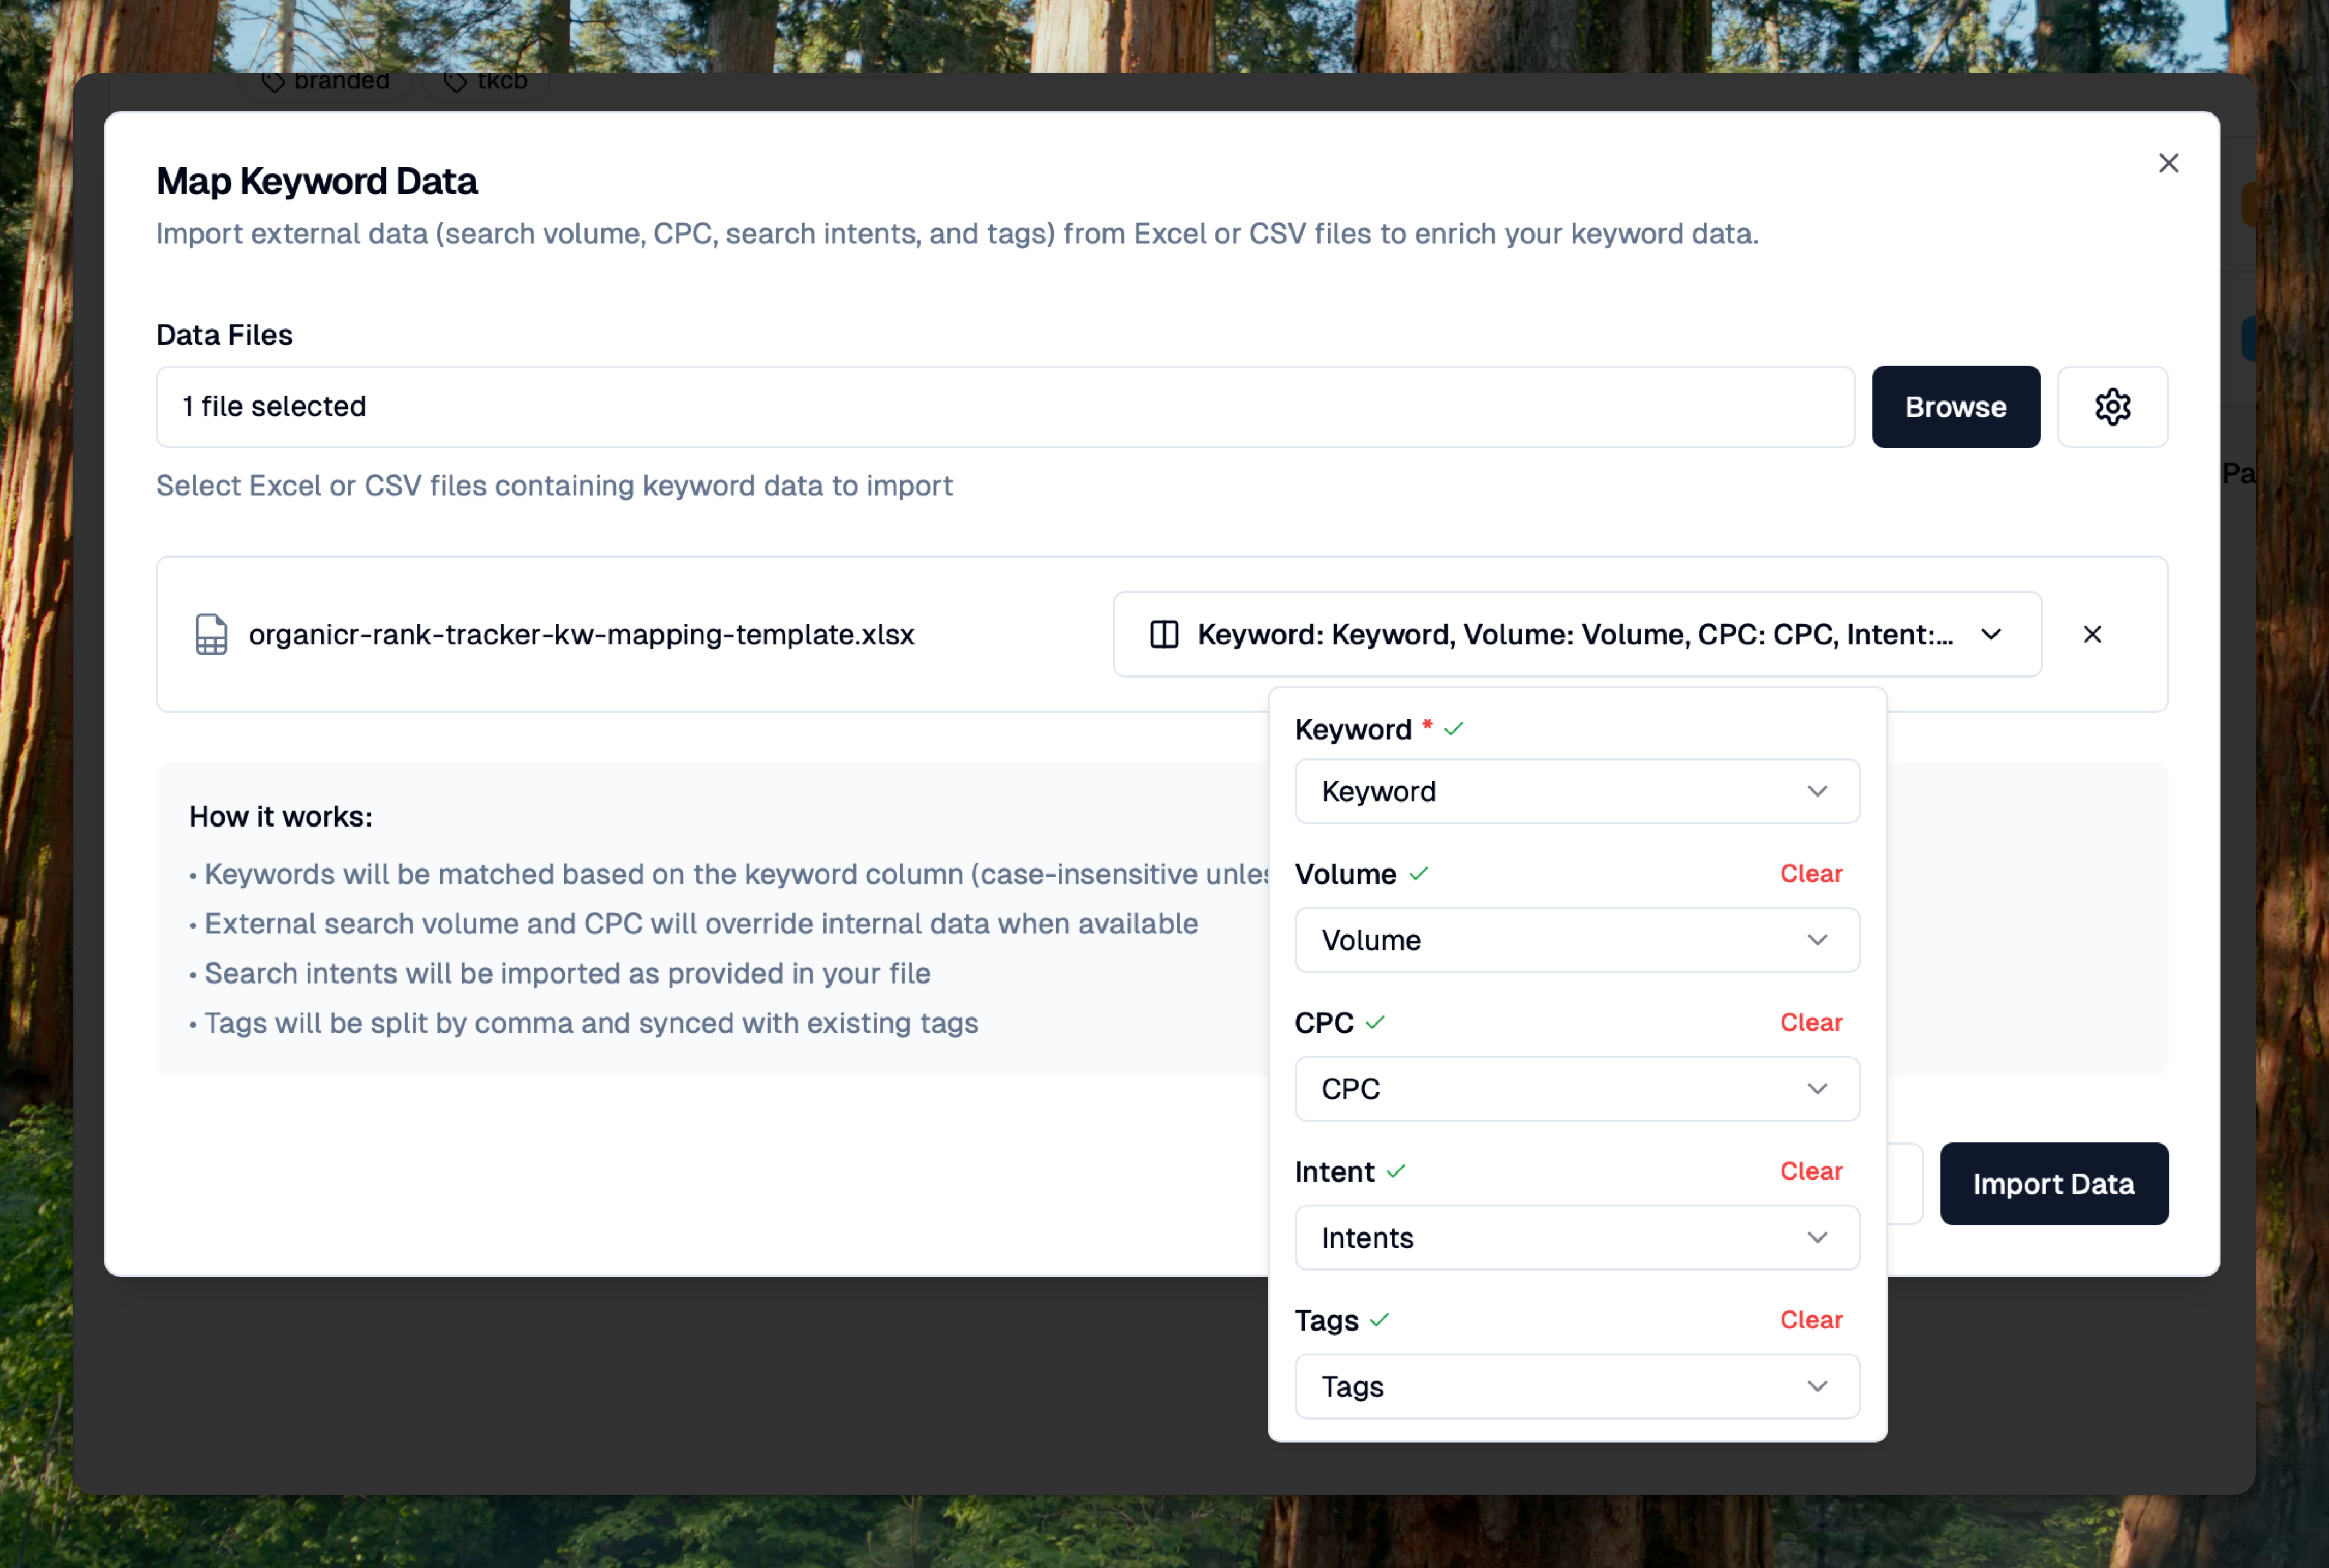
In the modal, select your Excel or CSV files containing the keyword data
Map the columns from your file to the appropriate data types (Keyword, Volume, CPC, Intent, Tags)
Click "Import Data" to sync the external metrics with your keywords

Important notes:
Keywords are matched case-insensitively by default (you can preserve case if needed)
External metrics will override any existing internal data
Tags should be comma-separated in your file (e.g., "seo, analytics, tools")
Multiple files can be imported at once if your data is spread across different sources
Example Template: Download this sample Google Sheets template to see the recommended format for importing keyword data.
Delete Keywords by Text
To delete specific keywords without searching through the table:
Click on the keyword count to go to the keywords management page
Click on the dropdown menu (three dots) in the page header
Select "Delete Keywords"
Enter or paste keywords to delete (one per line or comma-separated)
Click "Delete" to remove matching keywords
Only exact matches will be deleted. After deletion, you'll see a summary of how many keywords were deleted and how many were not found.

Deleting keywords will permanently remove all historical ranking data for those keywords. This action cannot be undone.
Manage competitors
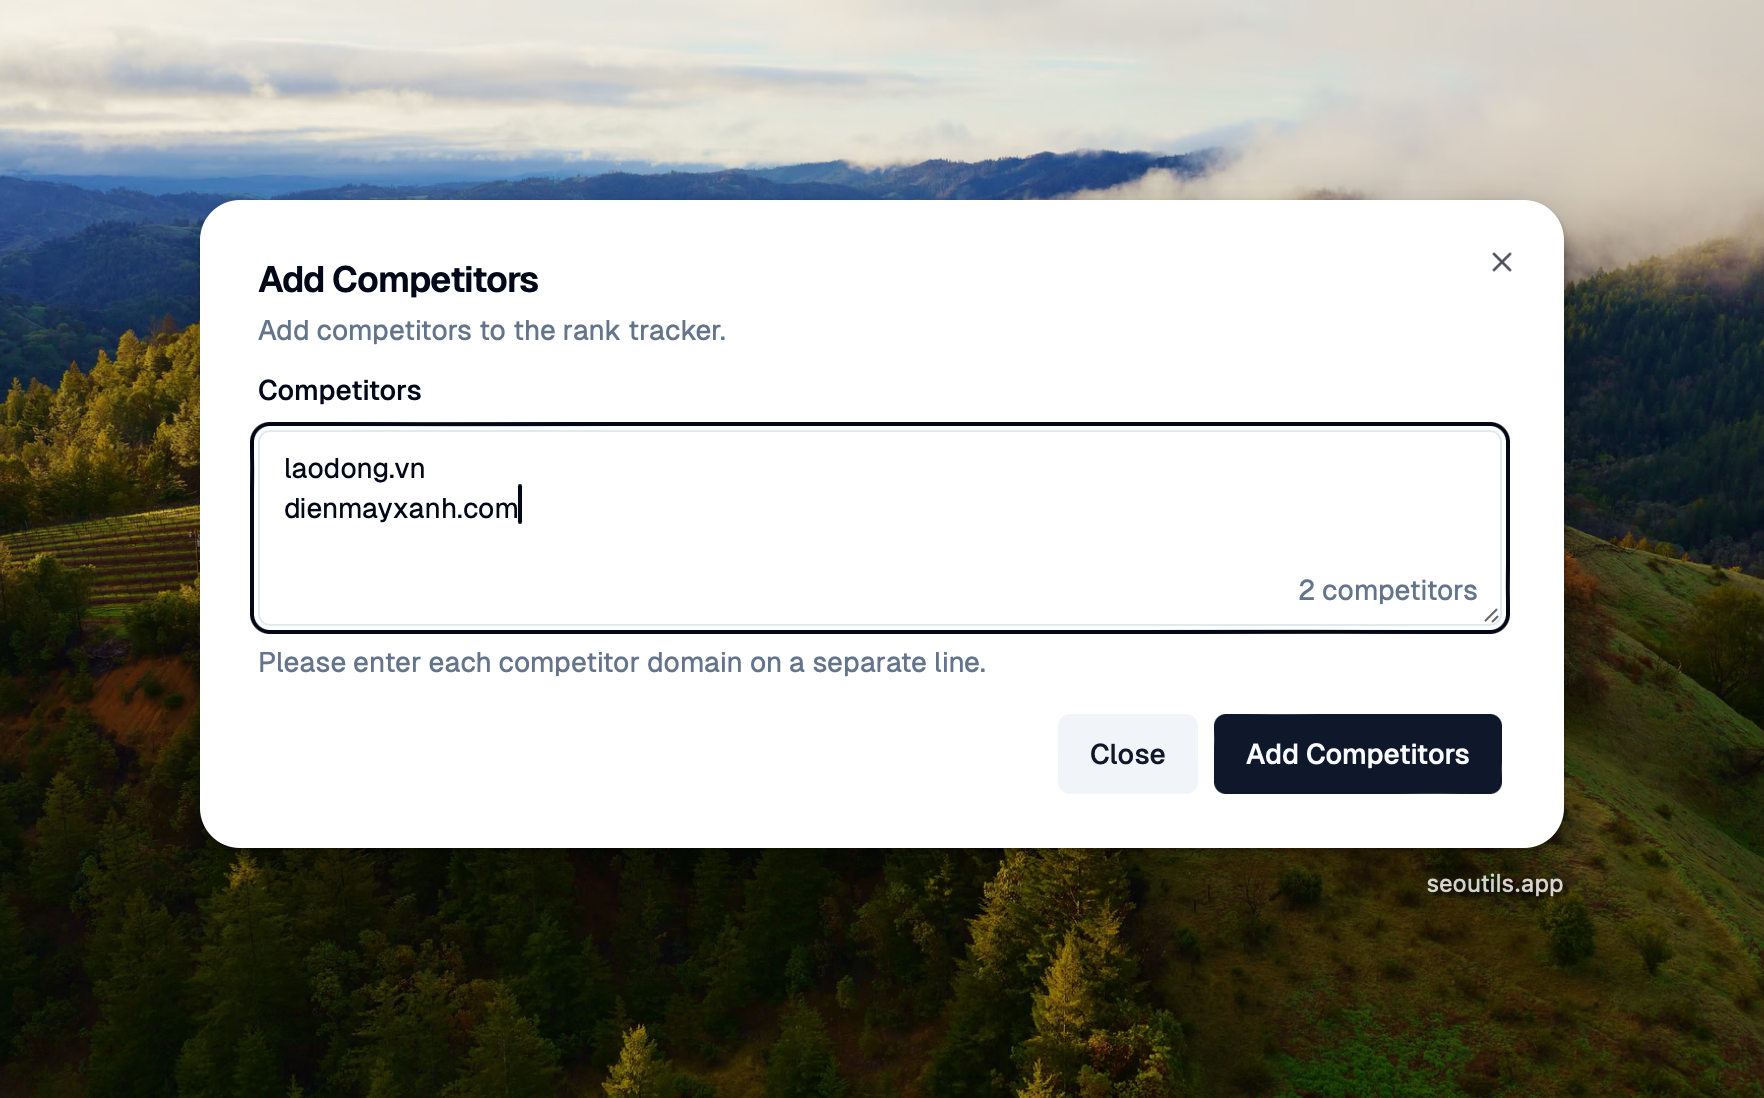
To manage your competitors, click on the competitors count. This will redirect you to a page where you can add or remove competitors as needed.

Tracking Competitor Business Names in Local Pack
You can also track competitor business names in Google's Local Pack by entering them in this format:domain.com|Business Name
For example: happylambhotpot.com|Happy Lamb Hot Pot
This allows you to monitor both organic rankings and Local Pack positions for your competitors, giving you a complete view of the competitive landscape.
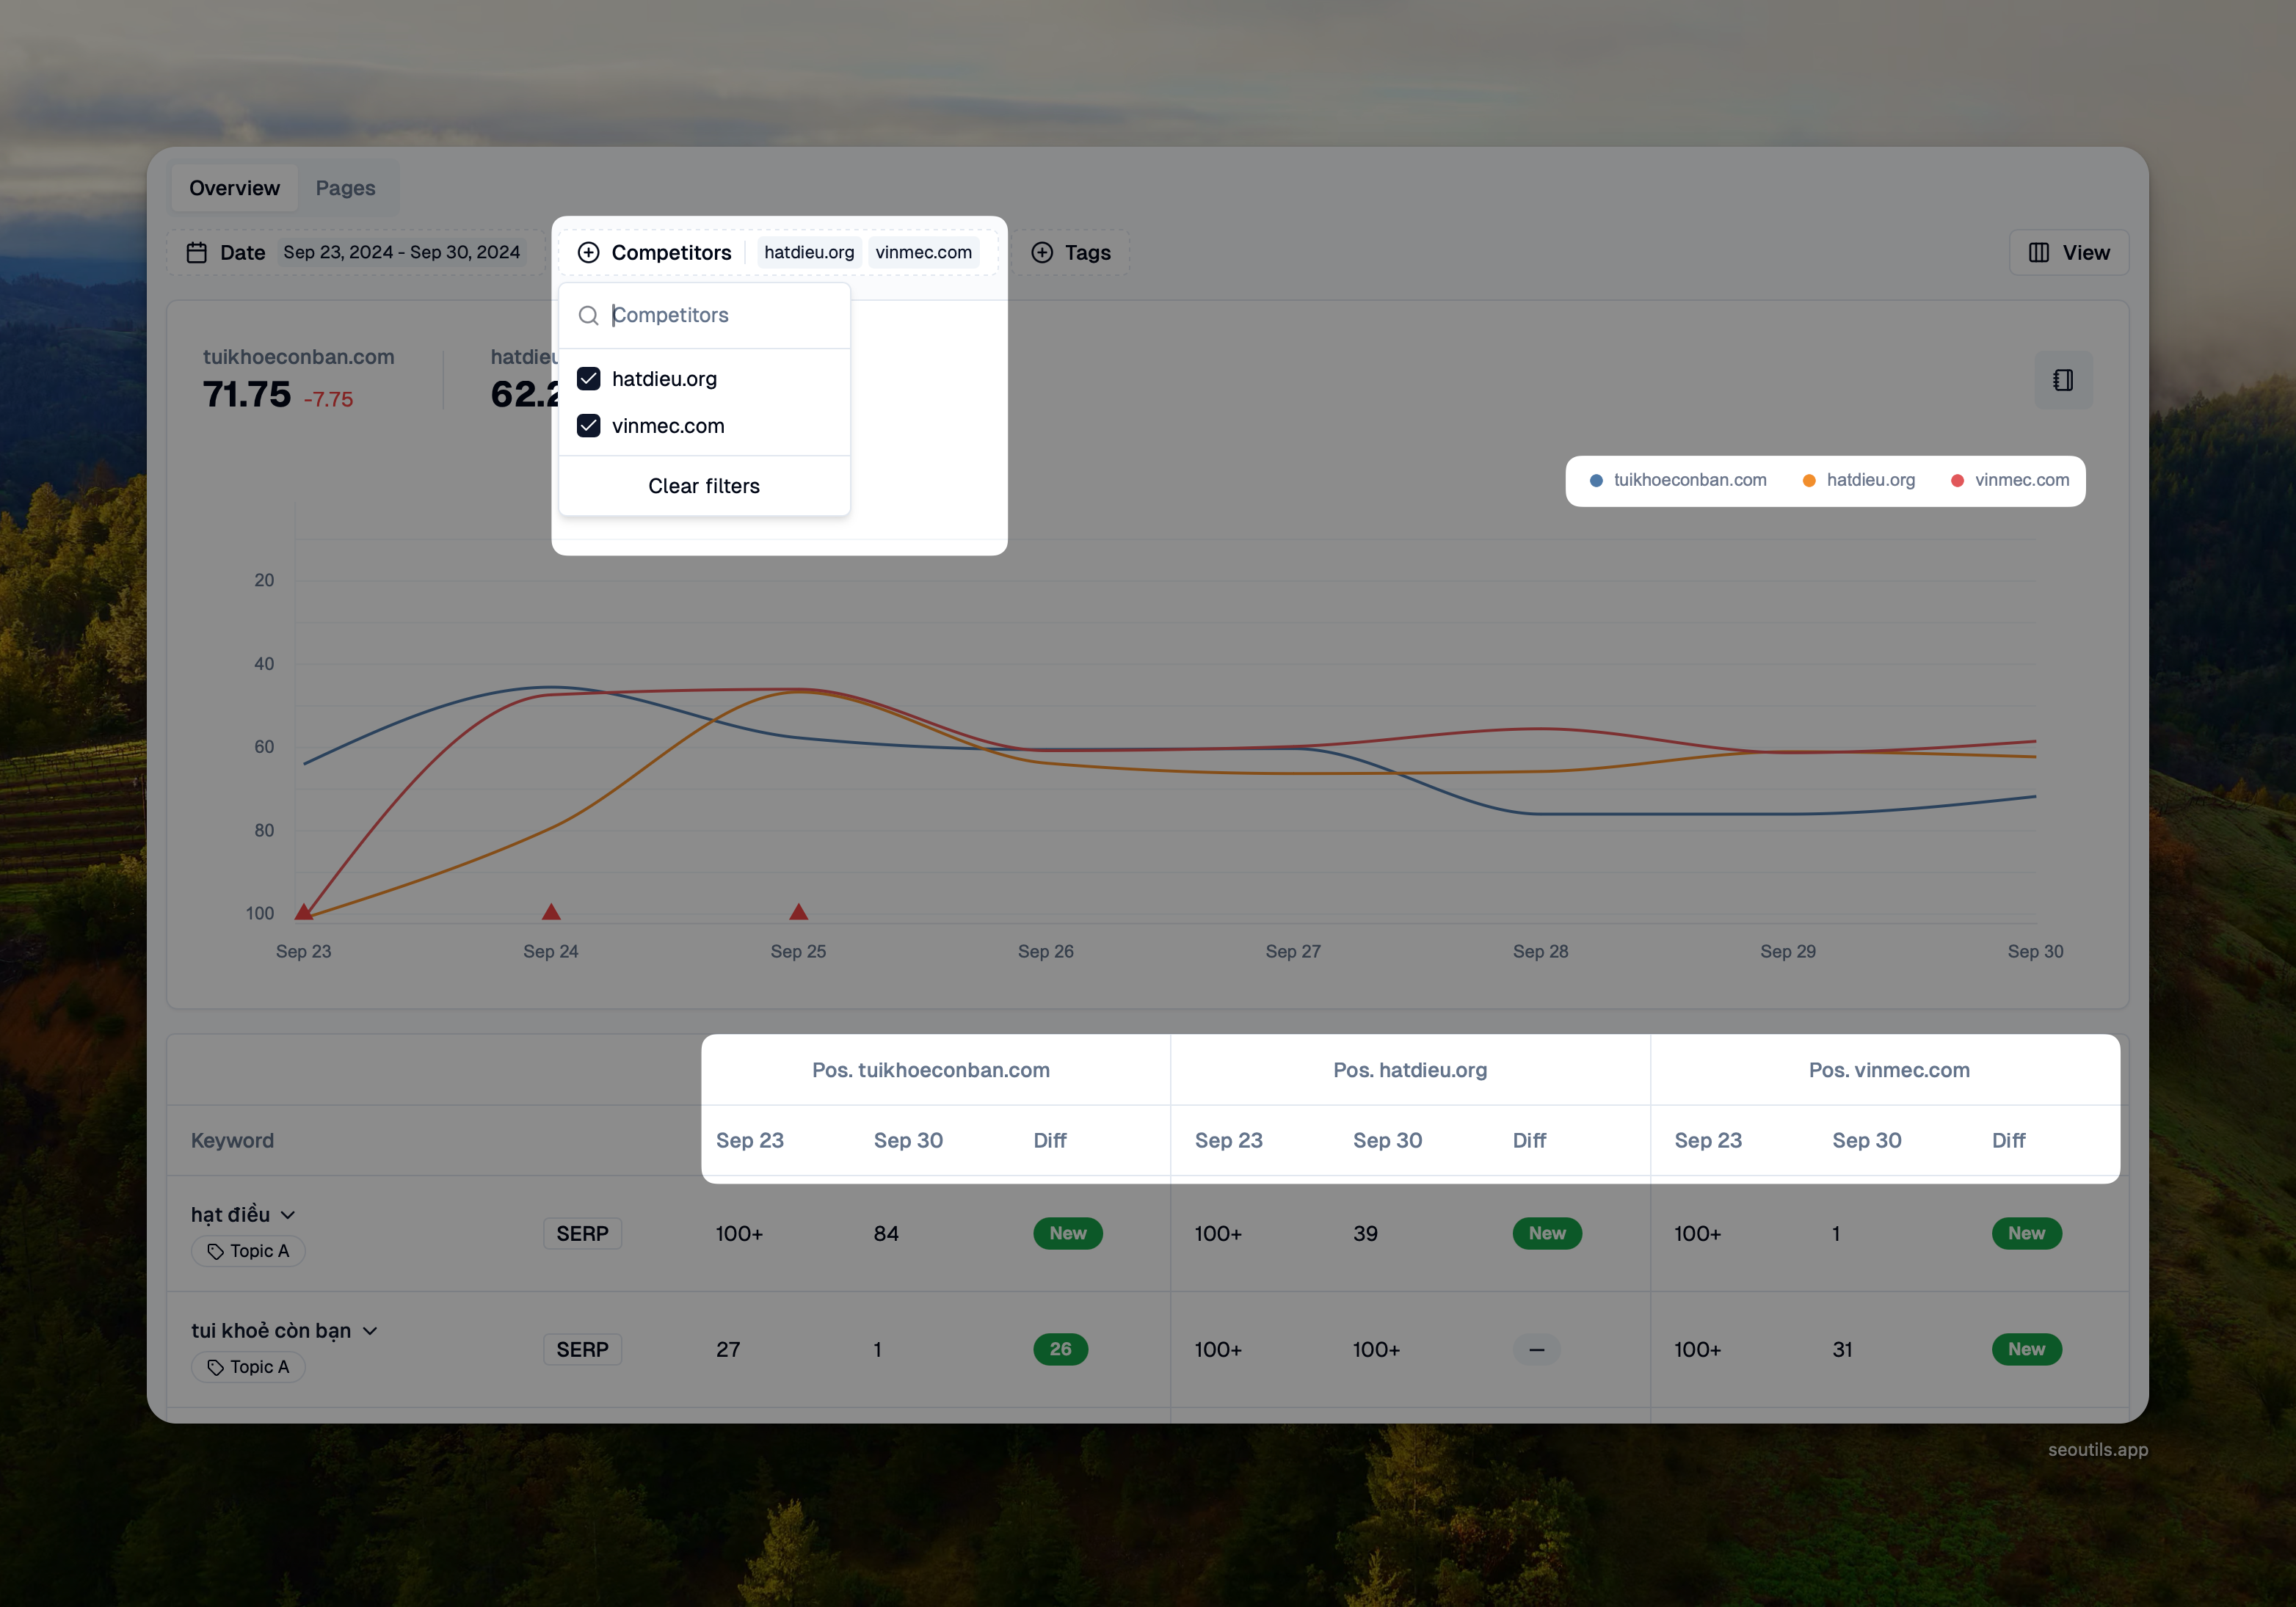
Once youβve added competitors, youβll be able to filter them using the Competitors Filter for more focused analysis.

SEO Utils automatically populates keyword ranking data for newly added competitors starting from the date you originally created the tracker, not just from the date you add competitors. This ensures you don't lose any historical data.
Manage snapshots
Each time the rank tracker runs, SEO Utils creates a snapshot containing all ranking data for that date. You can manage these snapshots to clean up old data or remove unwanted entries.
To access the snapshots management page, click on the "Snapshots" link in the report header, or navigate to Rank Trackers > [Your Report] > Snapshots.
From this page, you can:
View all snapshots with their date and ID
Delete snapshots you no longer need

Important: Deleting a snapshot will permanently remove all associated position data for that date. This action cannot be undone.
View Rank Tracker Report in Each Tab
Overview Tab
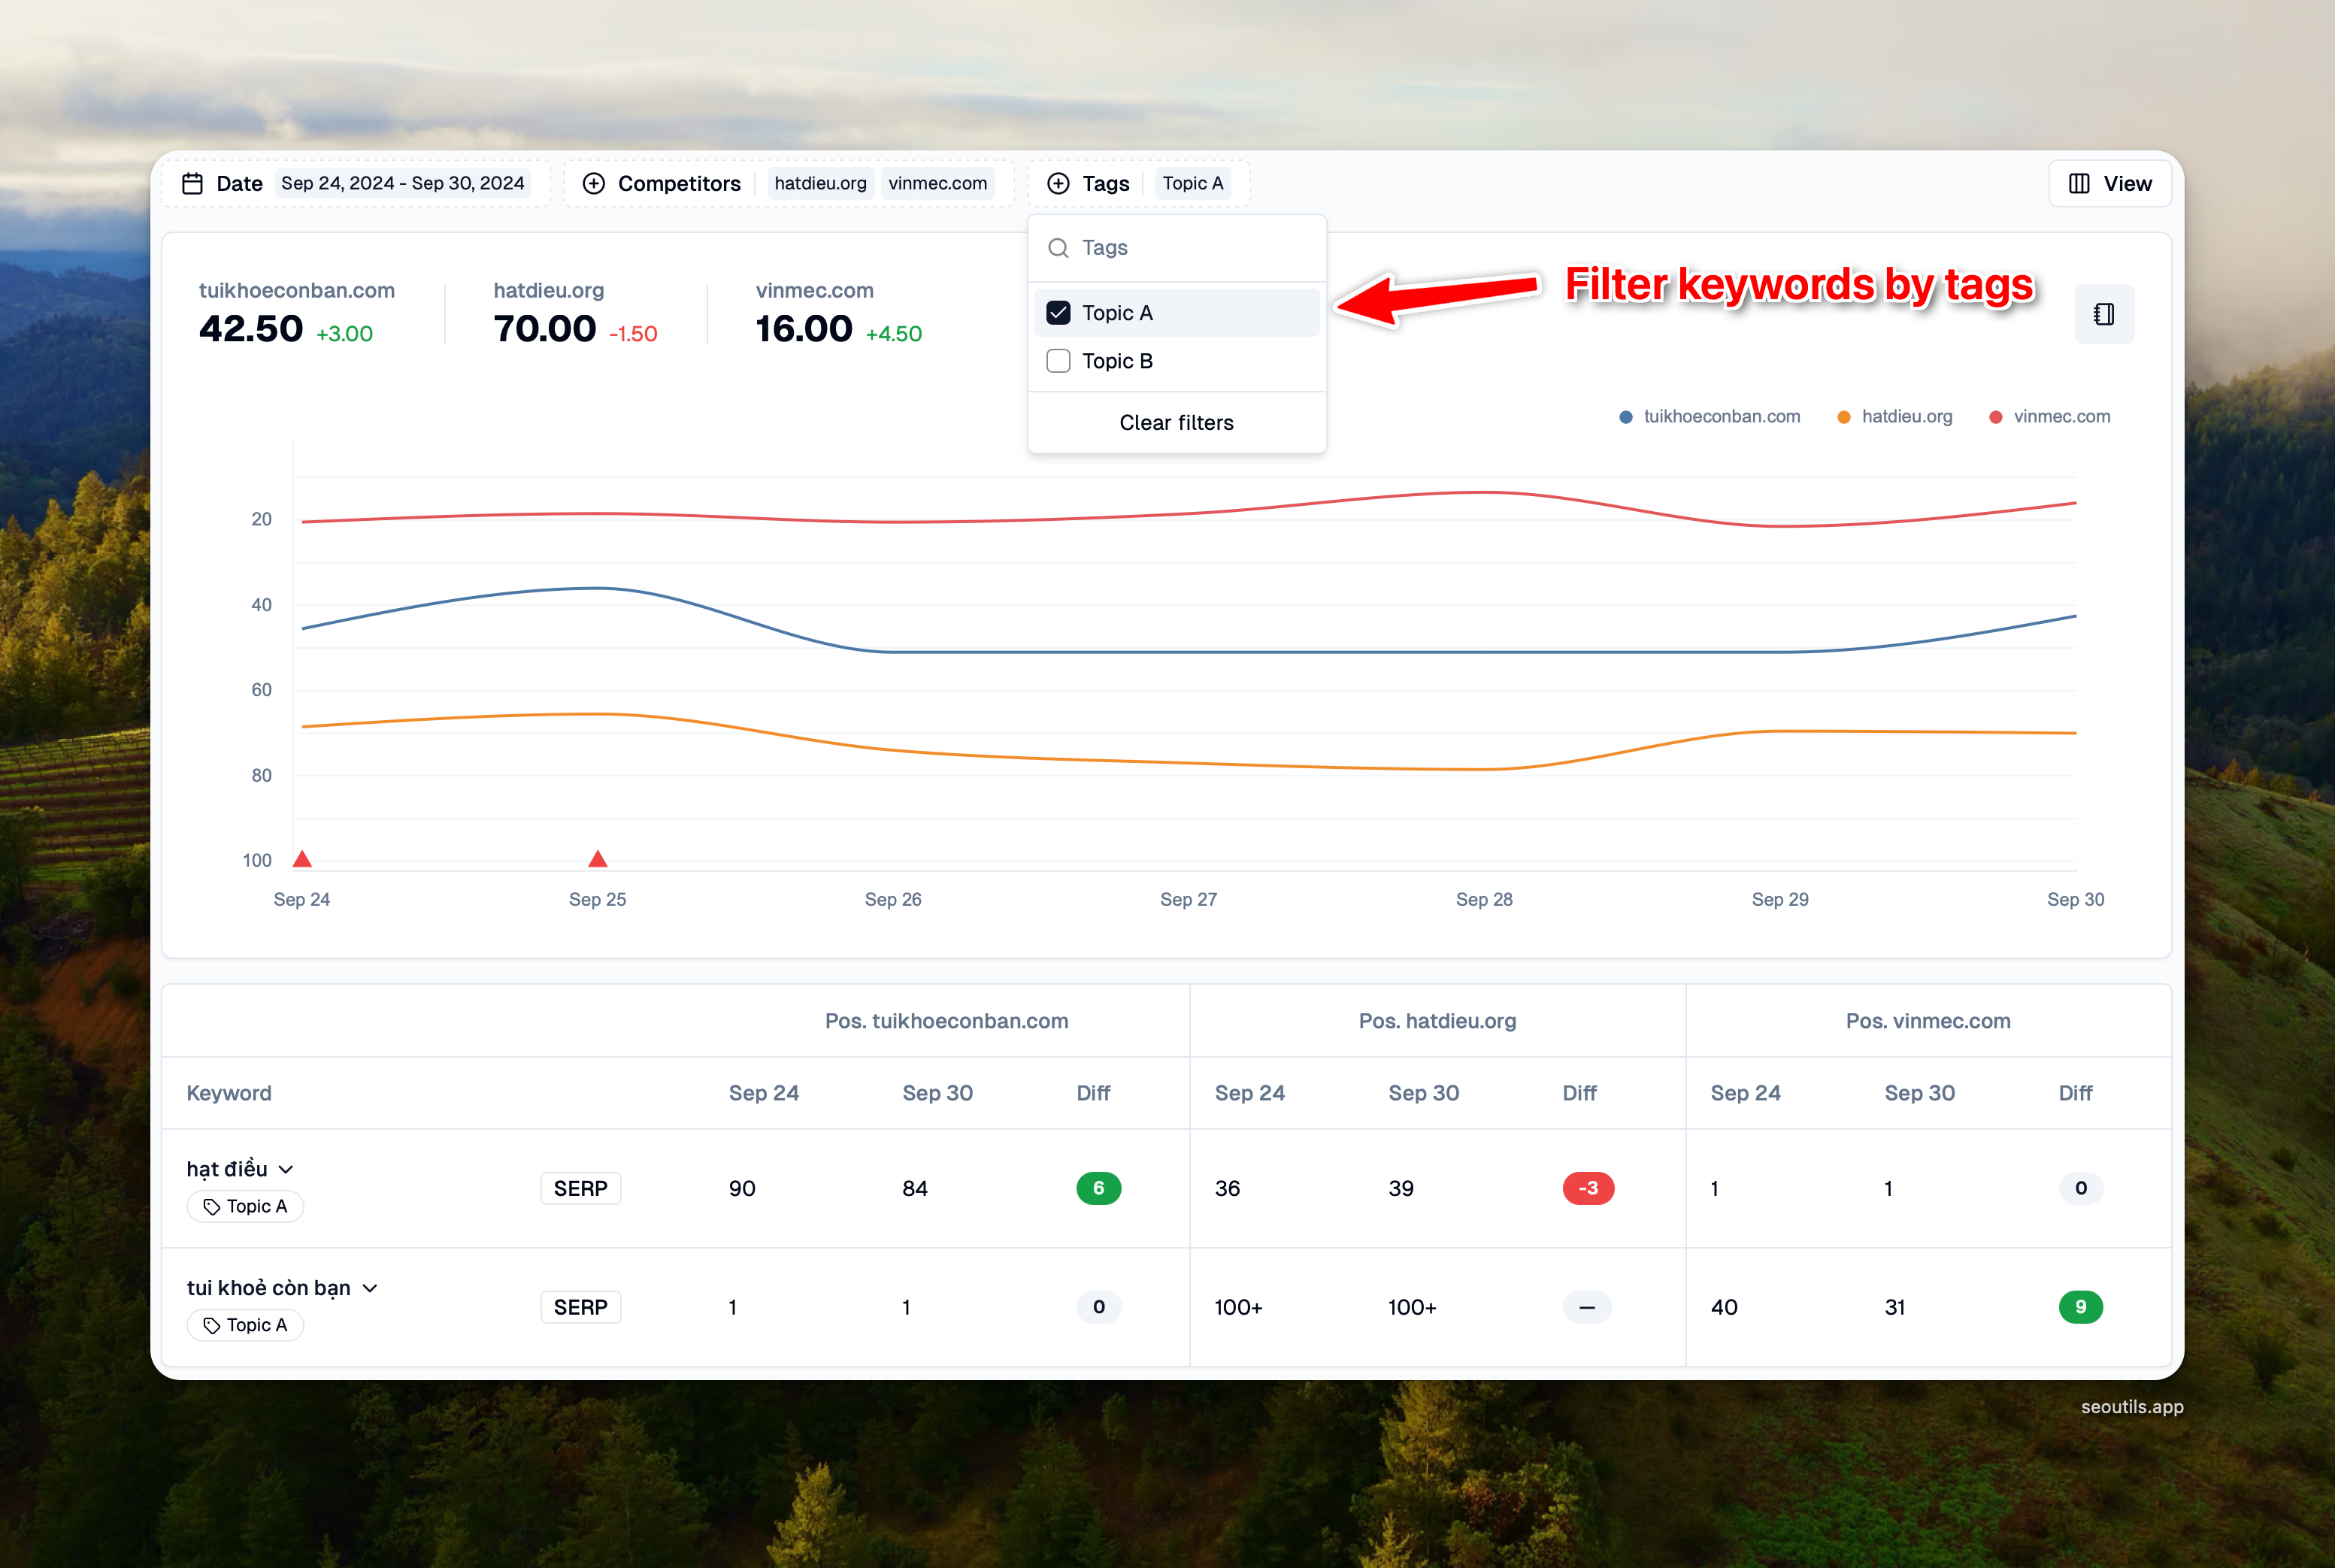
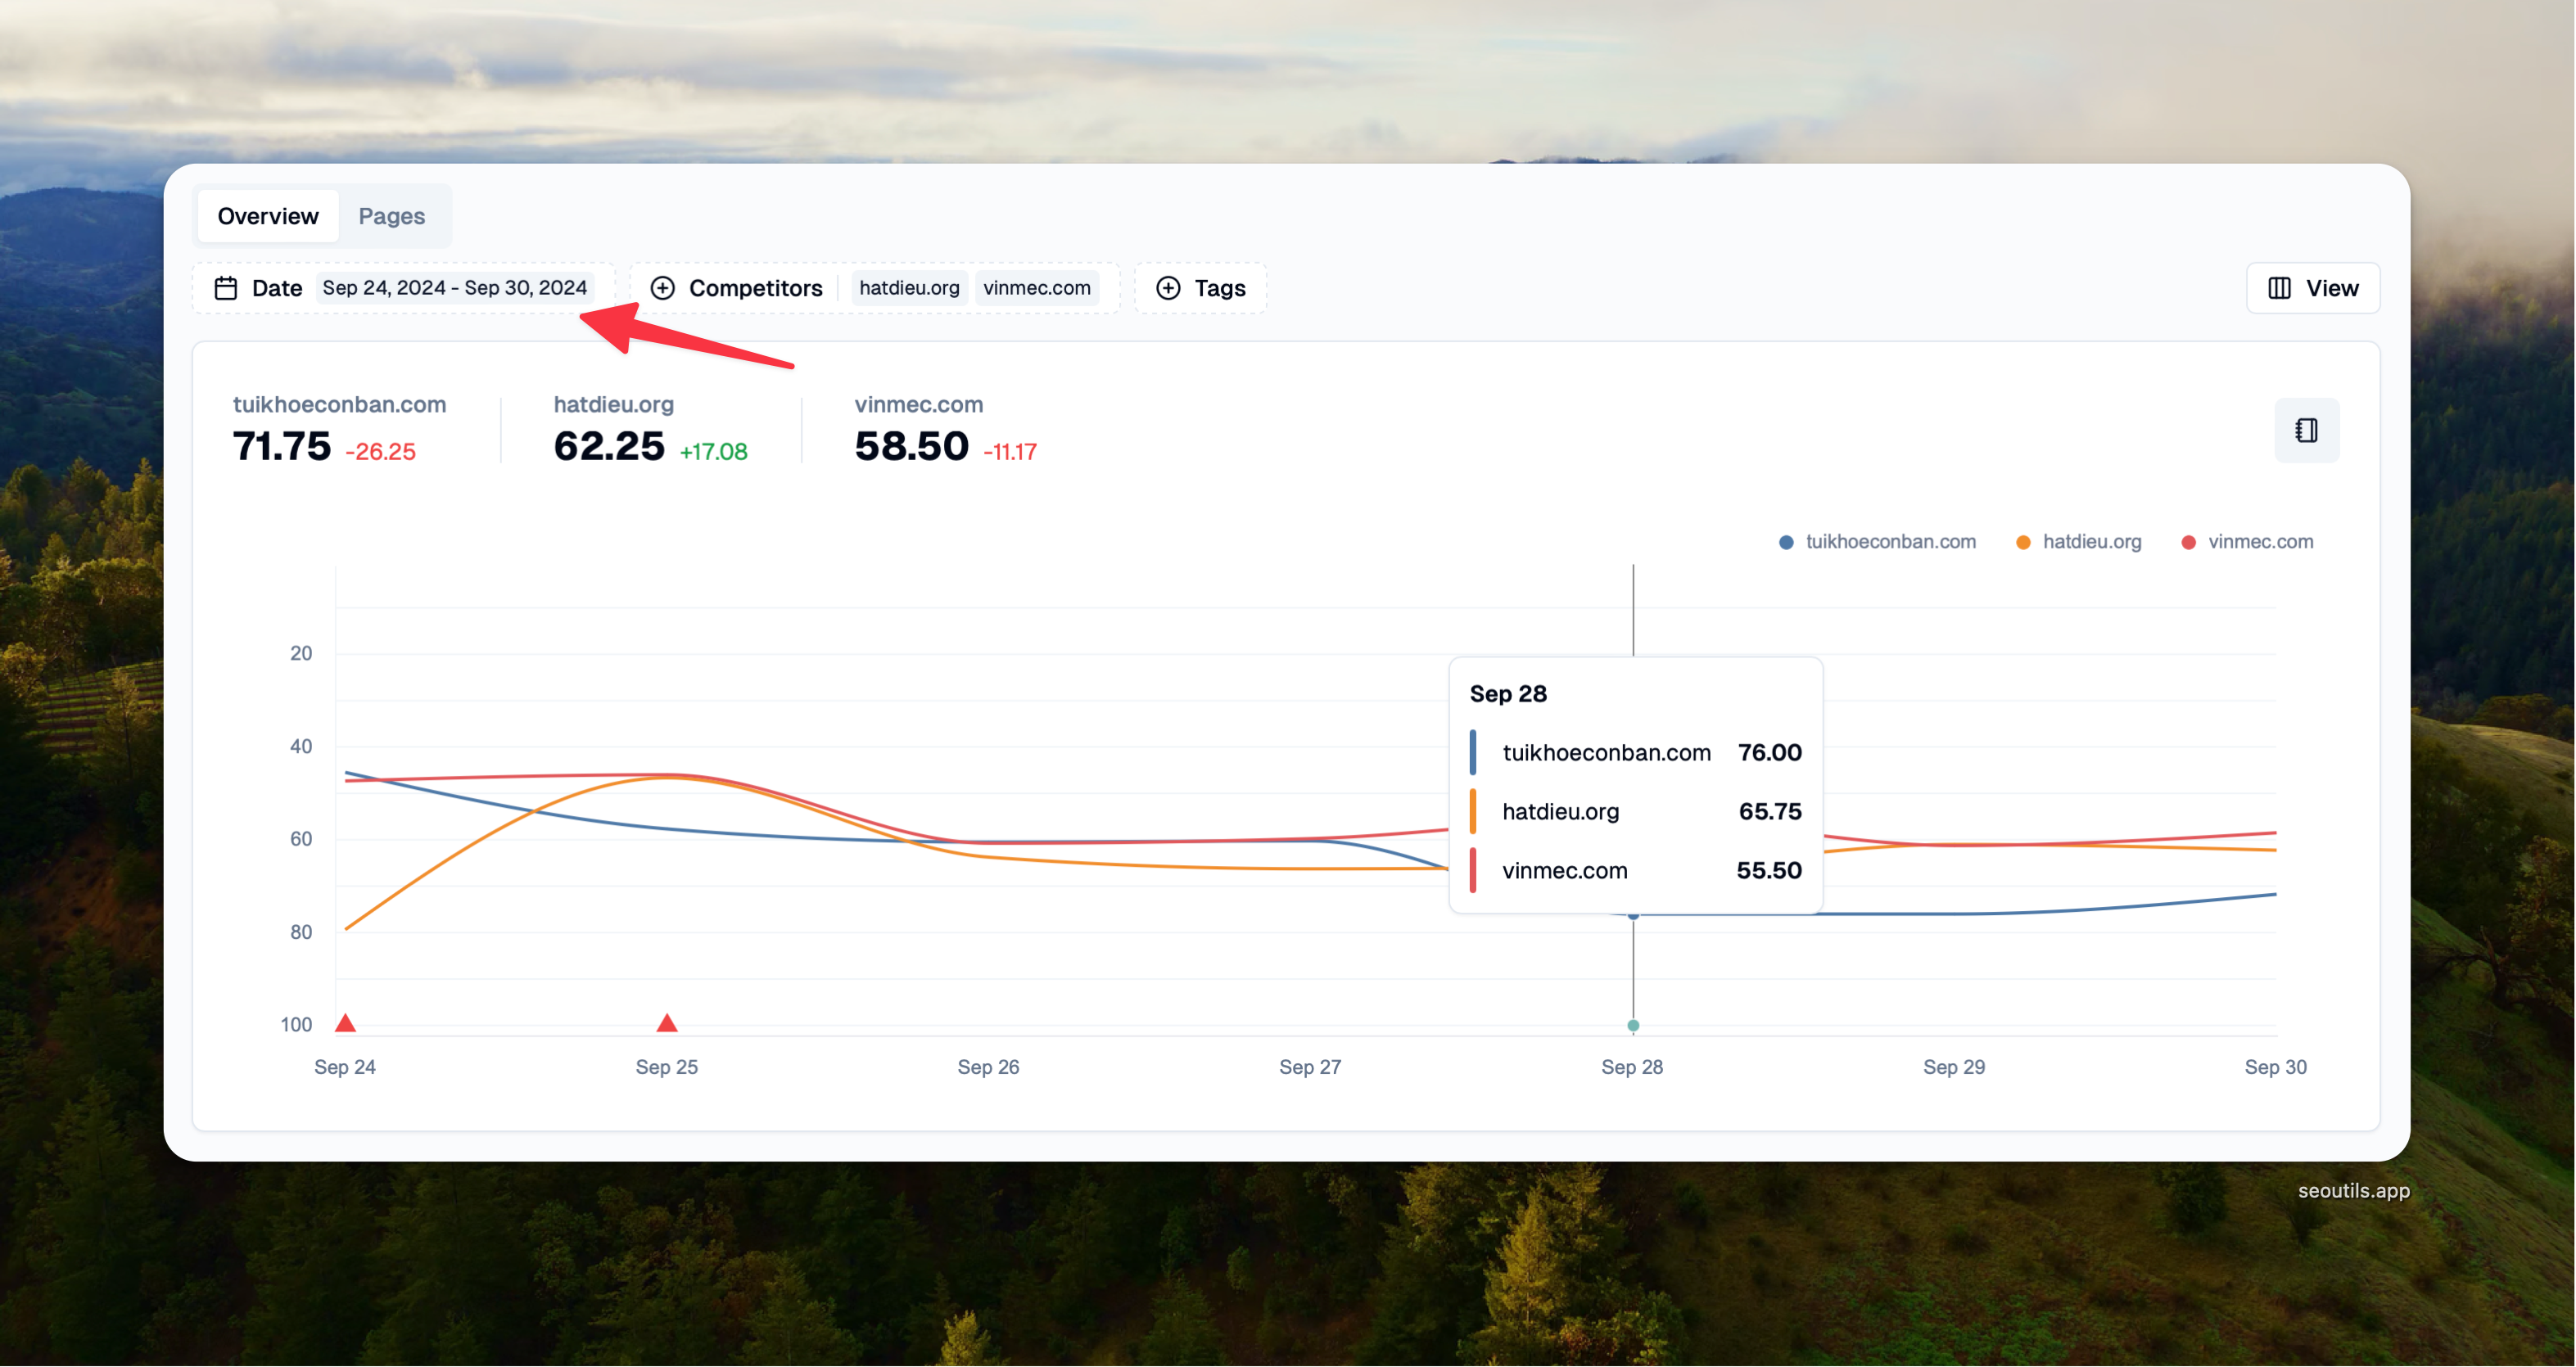
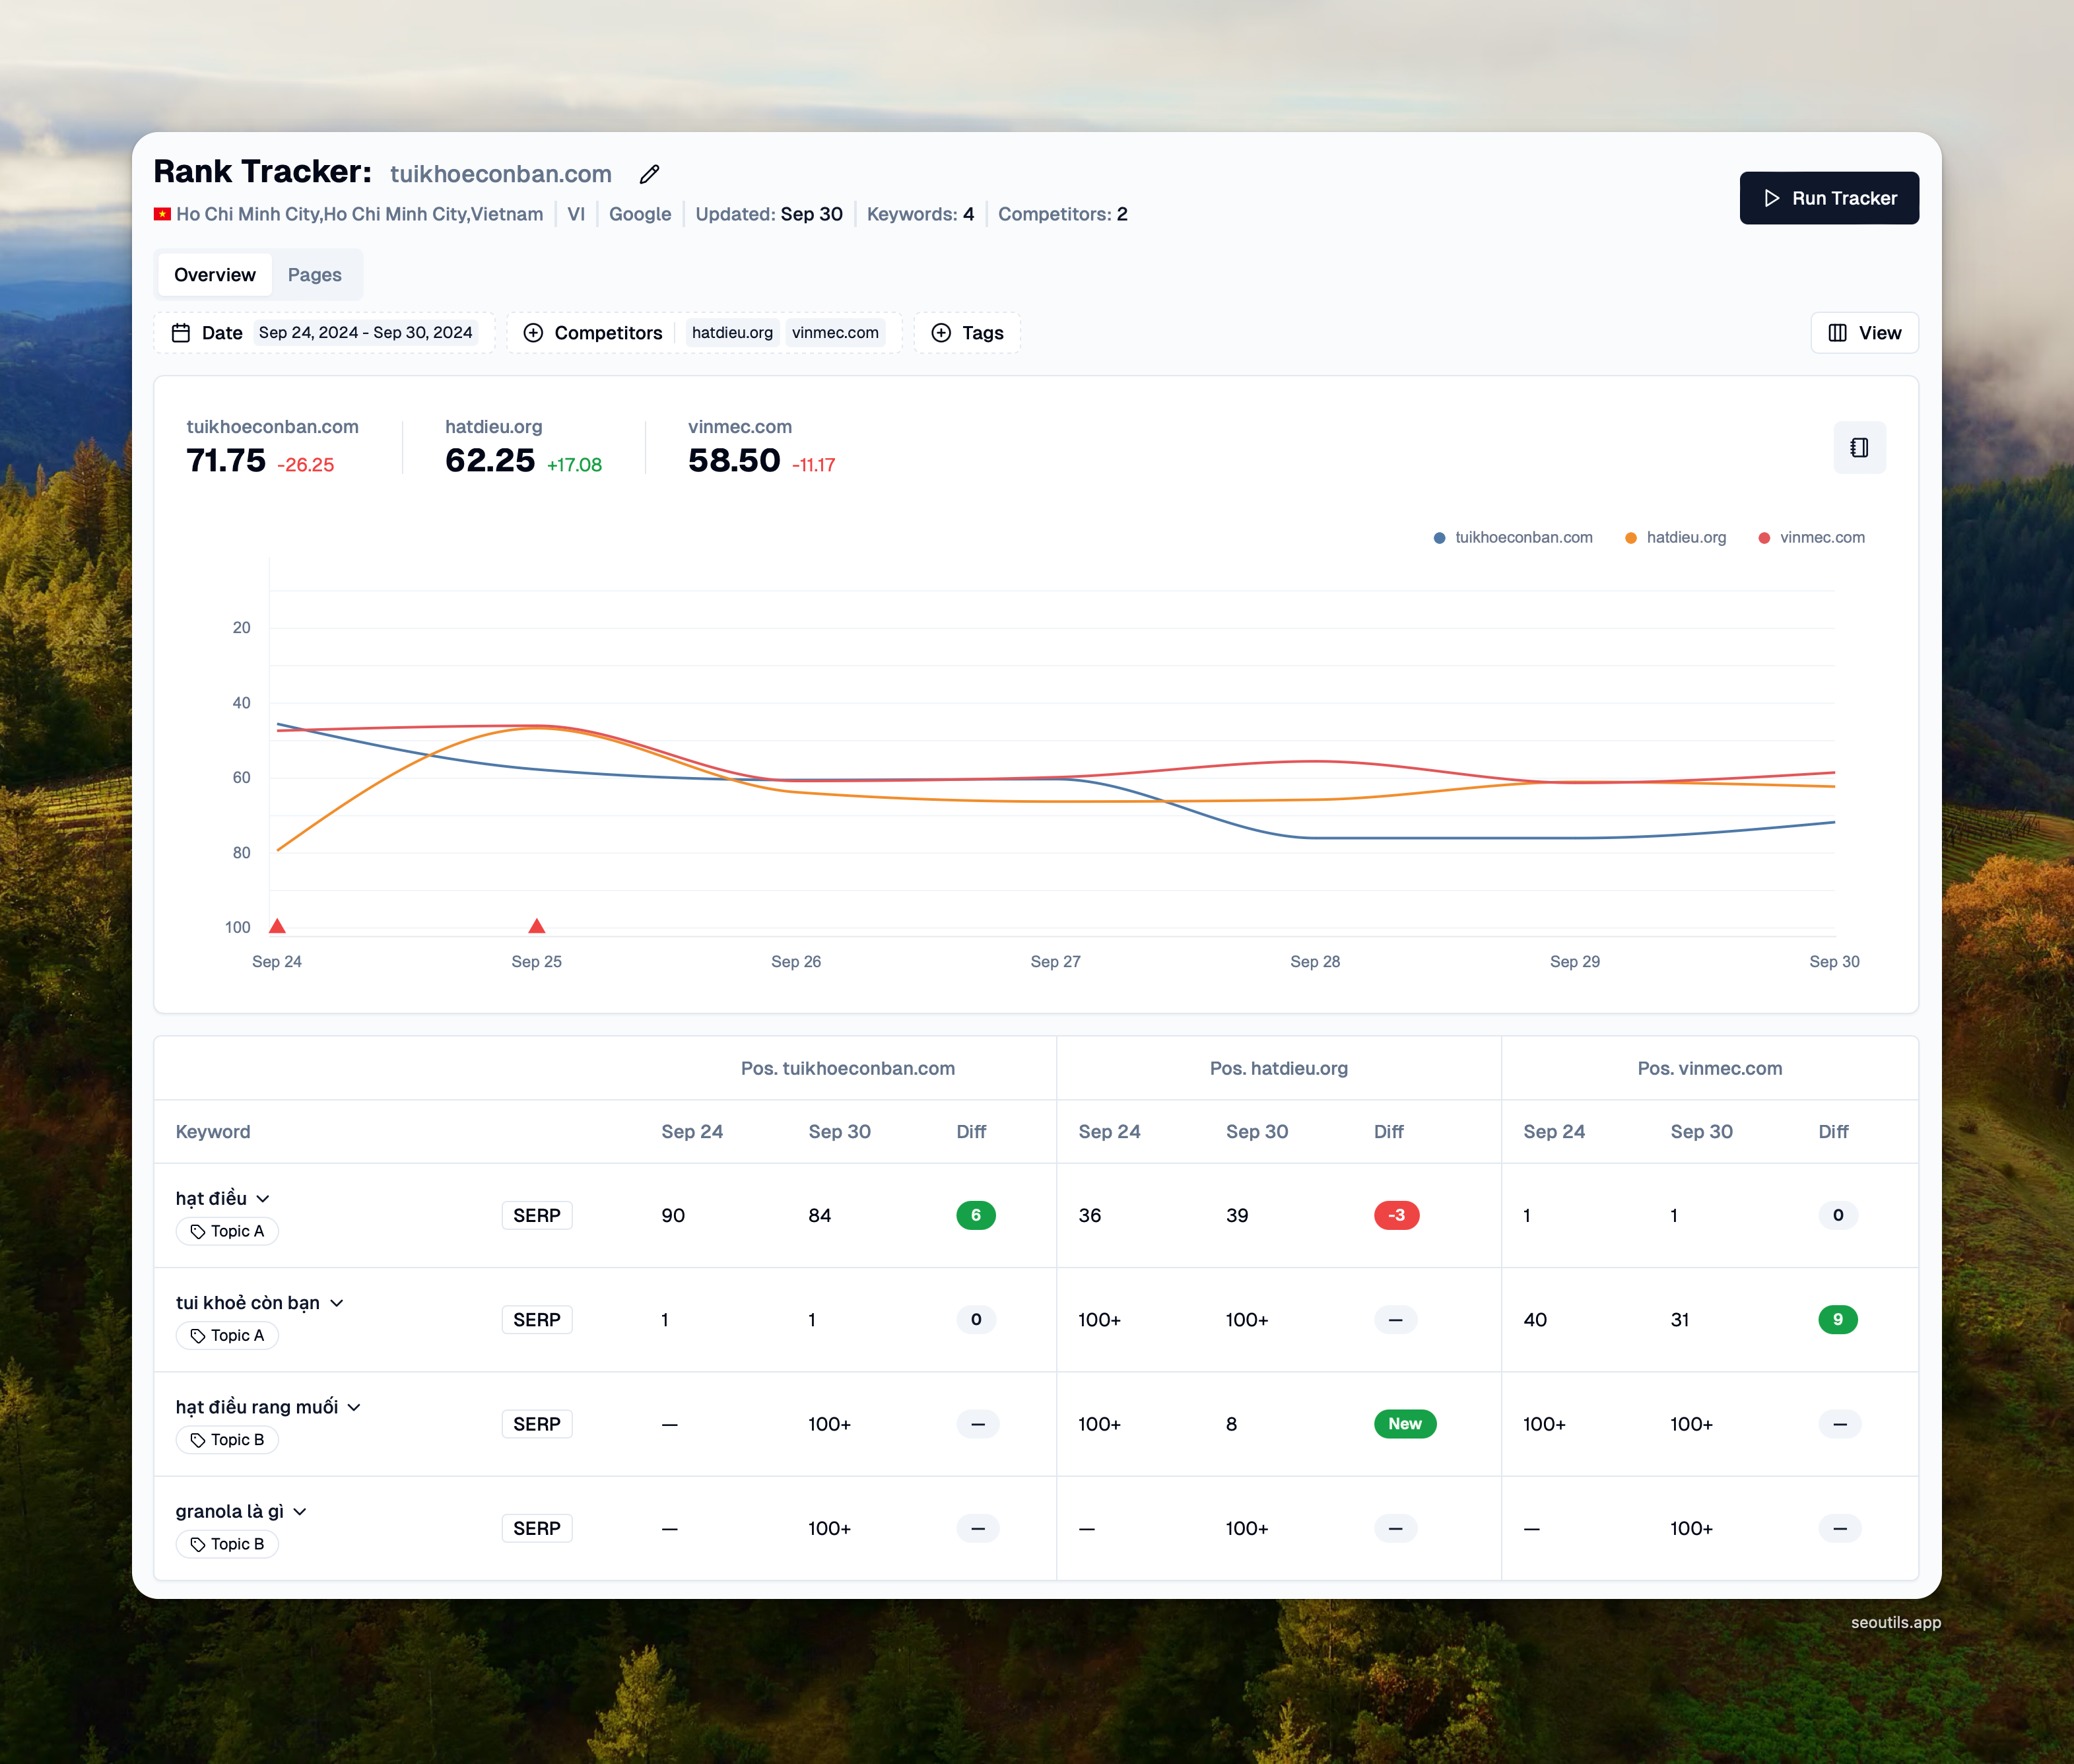
In this tab, youβll be able to view the average ranking. The line chart displays how your keywords and competitors perform over time within a specified date range.

The below table also reflects the changes when you update the filters.

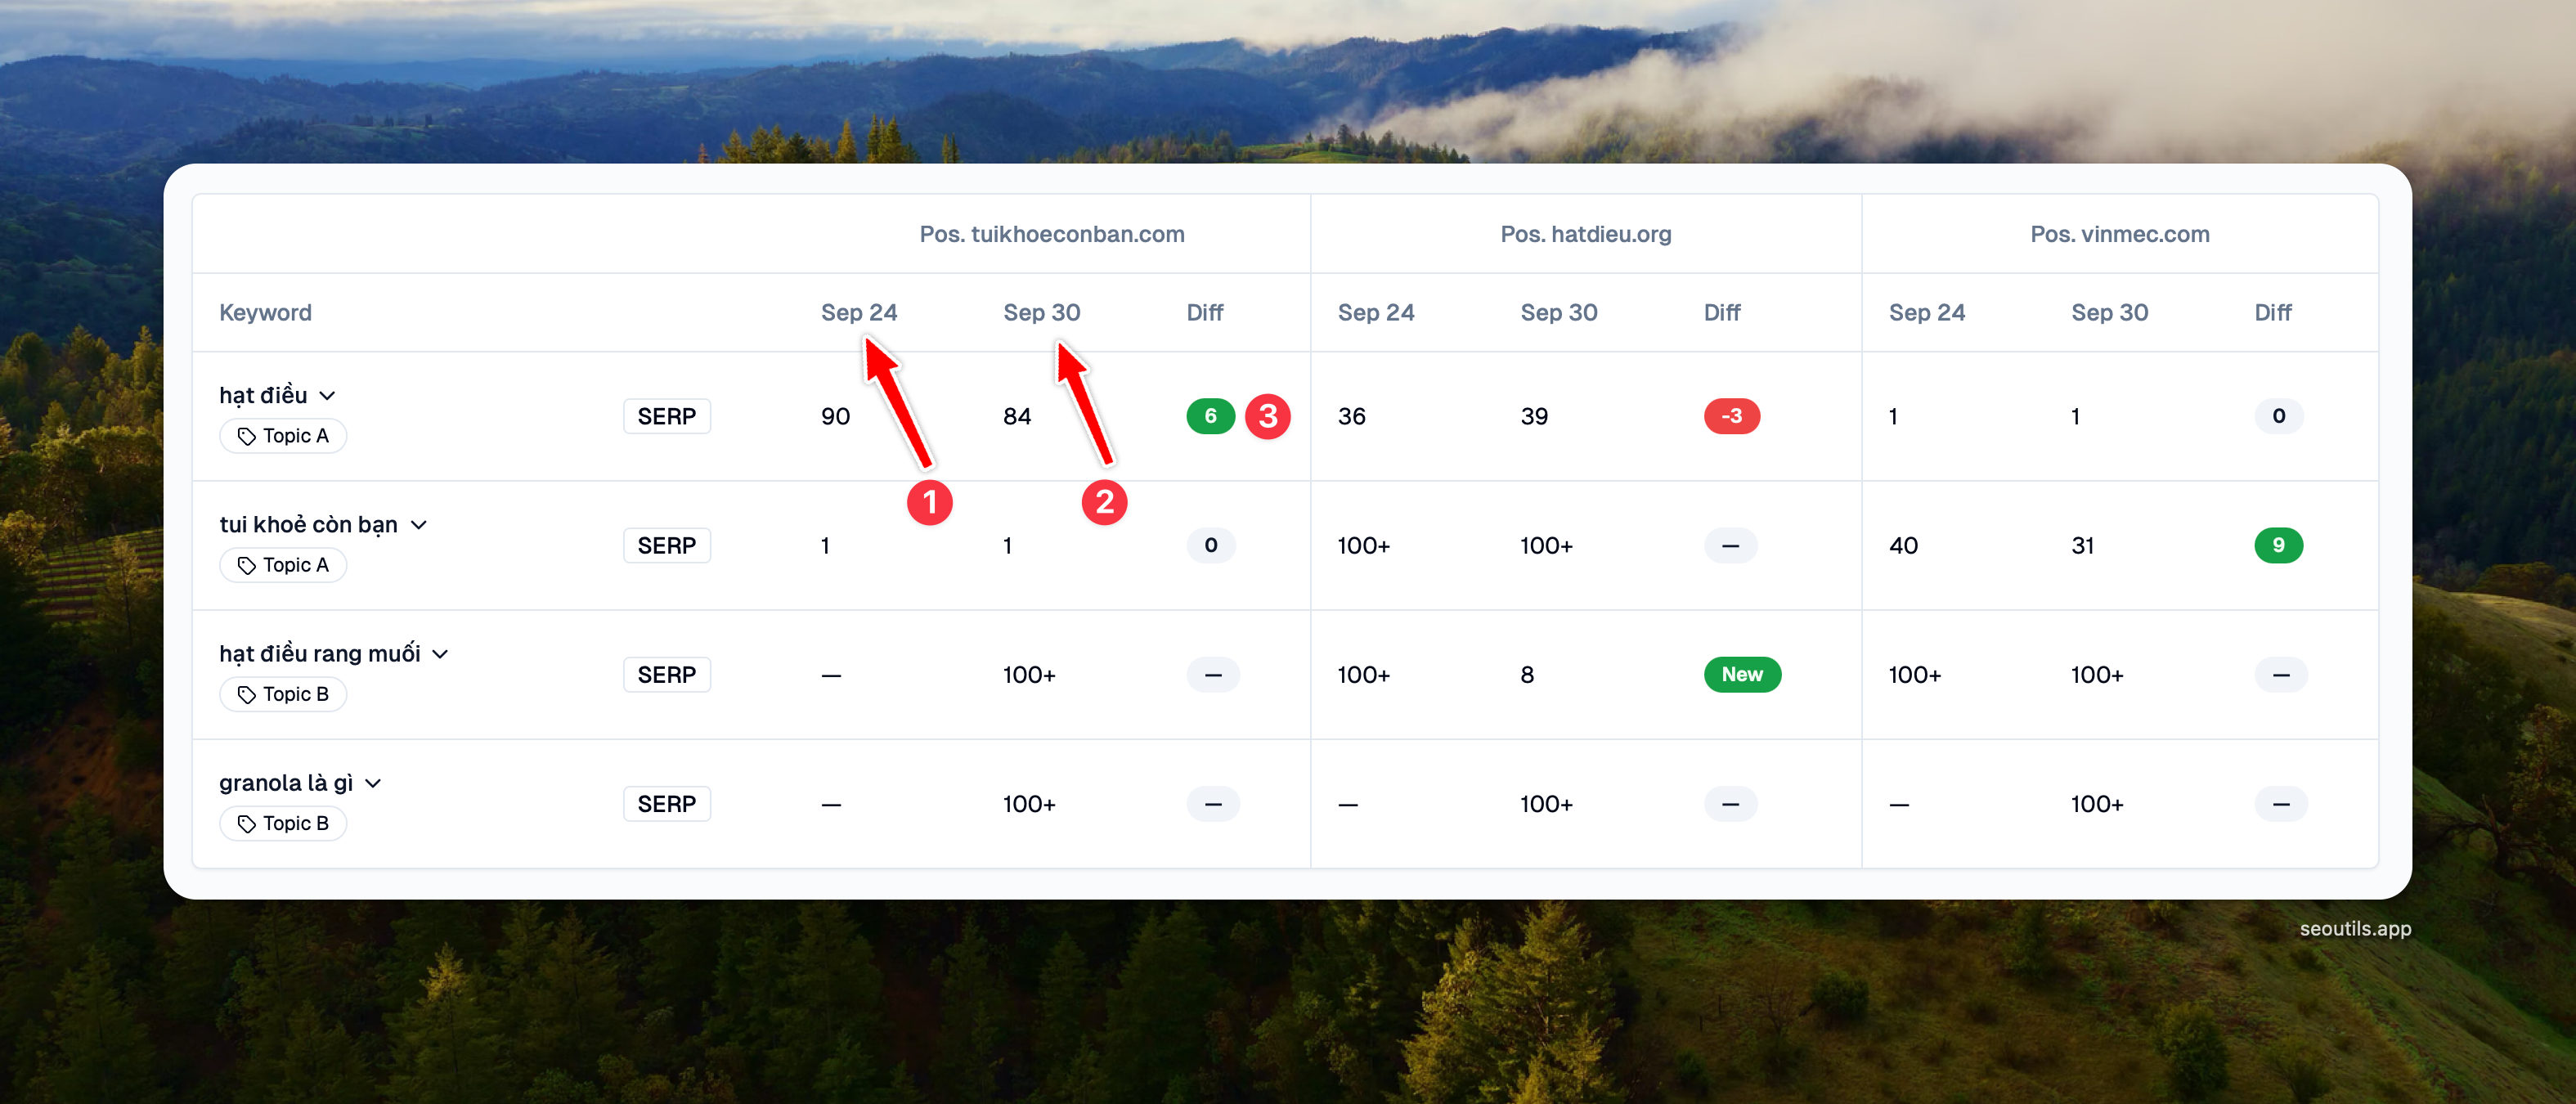
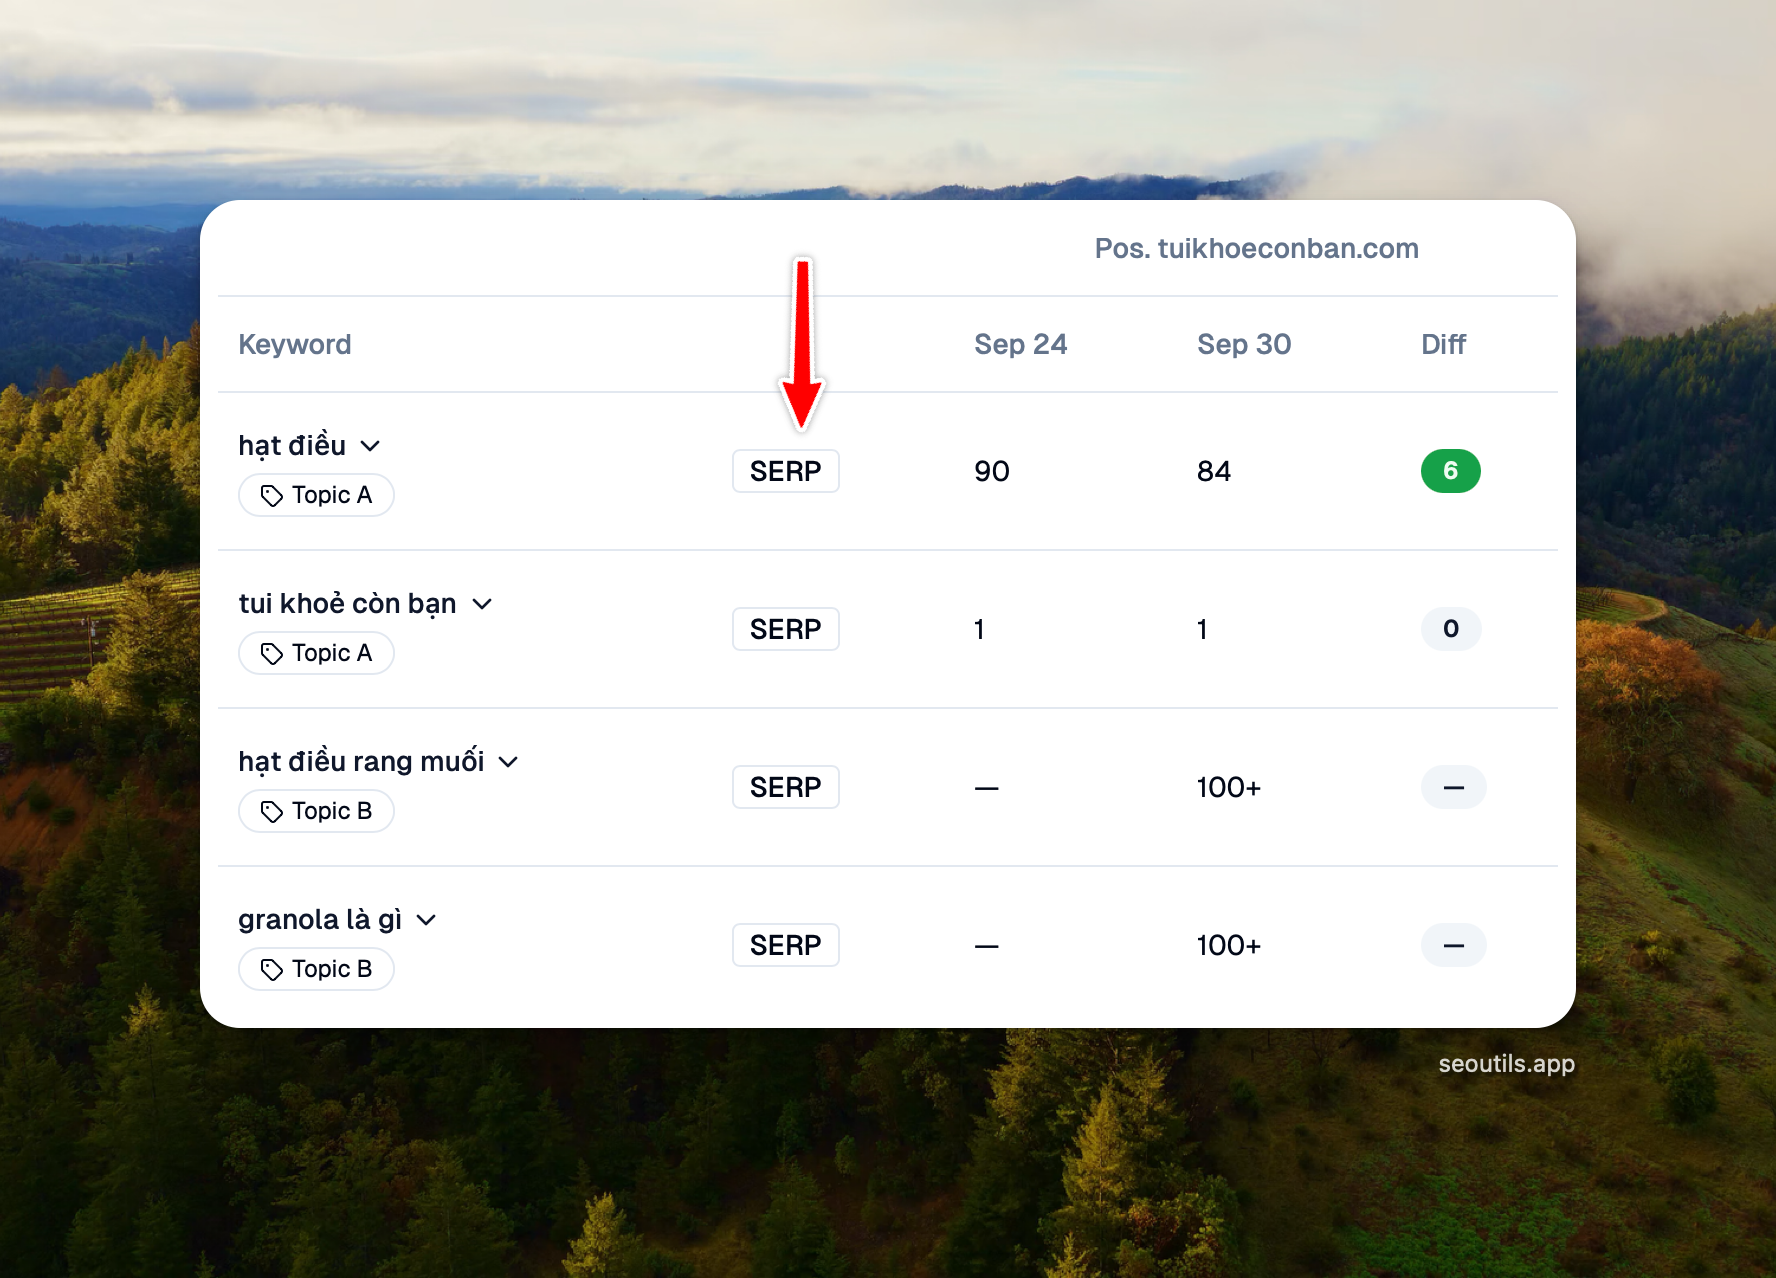
In the screenshot above, youβll see that the keyword βhαΊ‘t Δiα»uβ ranked at position 90 on Sep 24 (From Date) and improved to position 84 on Sep 30 (End Date), showing a gain of 6 positions. The green badge highlights this positive change in the keywordβs ranking. Conversely, if a keyword declines in ranking, the badge will appear red.
Important to know
If a keyword ranks outside the top 100, SEO Utils will display its position as β100+β in the position column.
If a keyword wasnβt added by a selected date, SEO Utils will display βββ, indicating no position data is available for that date.
If a keyword is outside the top 100 on the start date and then ranks within the top 100 by the end date, SEO Utils will display a green βNewβ badge. Conversely, if a keyword drops out of the top 100 by the end date, it will show a red βLostβ badge.
A keyword can rank for multiple pages within the same domain. SEO Utils only displays the best position. To view other positions, please switch to the Pages tab.
When your business appears in Google's Local Pack (top 3 local results), a πΊοΈ map pin icon will appear next to the position number to indicate this premium placement.

Pro Tips
To see your keyword ranking performance over the last 7 days, set the End Date to the current date and the From Date to 7 days ago. You can then observe keyword performance by examining the Diff column.
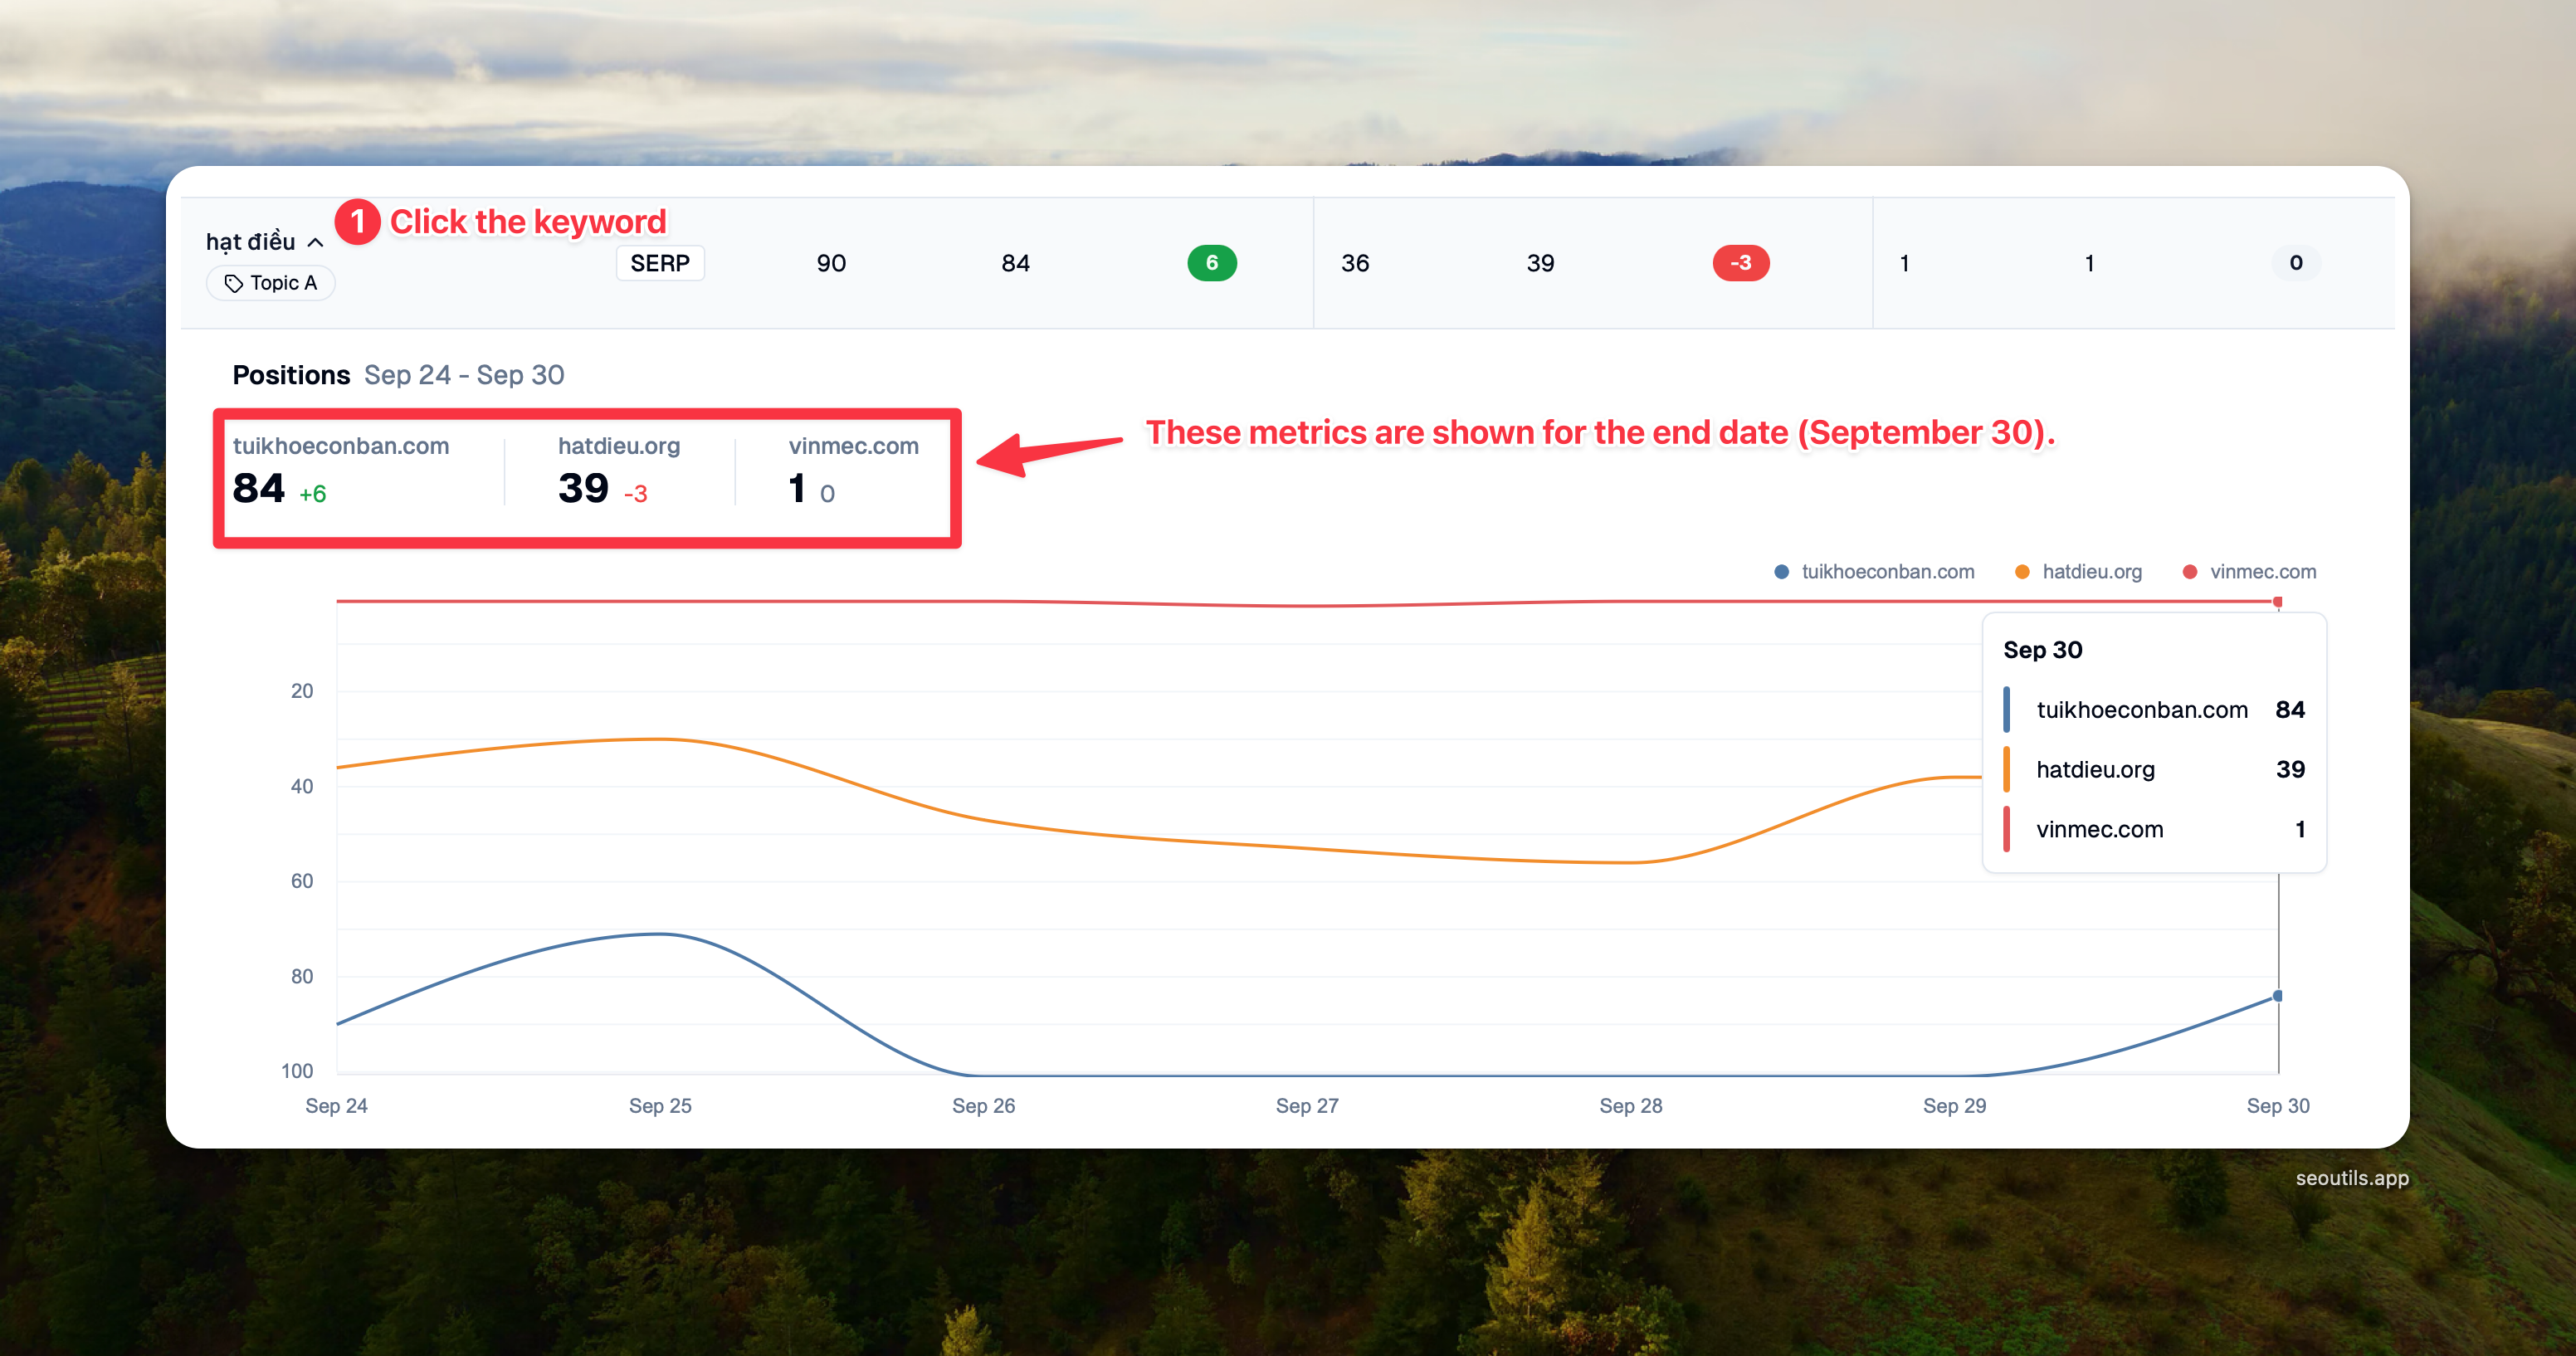
You can also click on a specific keyword to view its ranking performance over time.

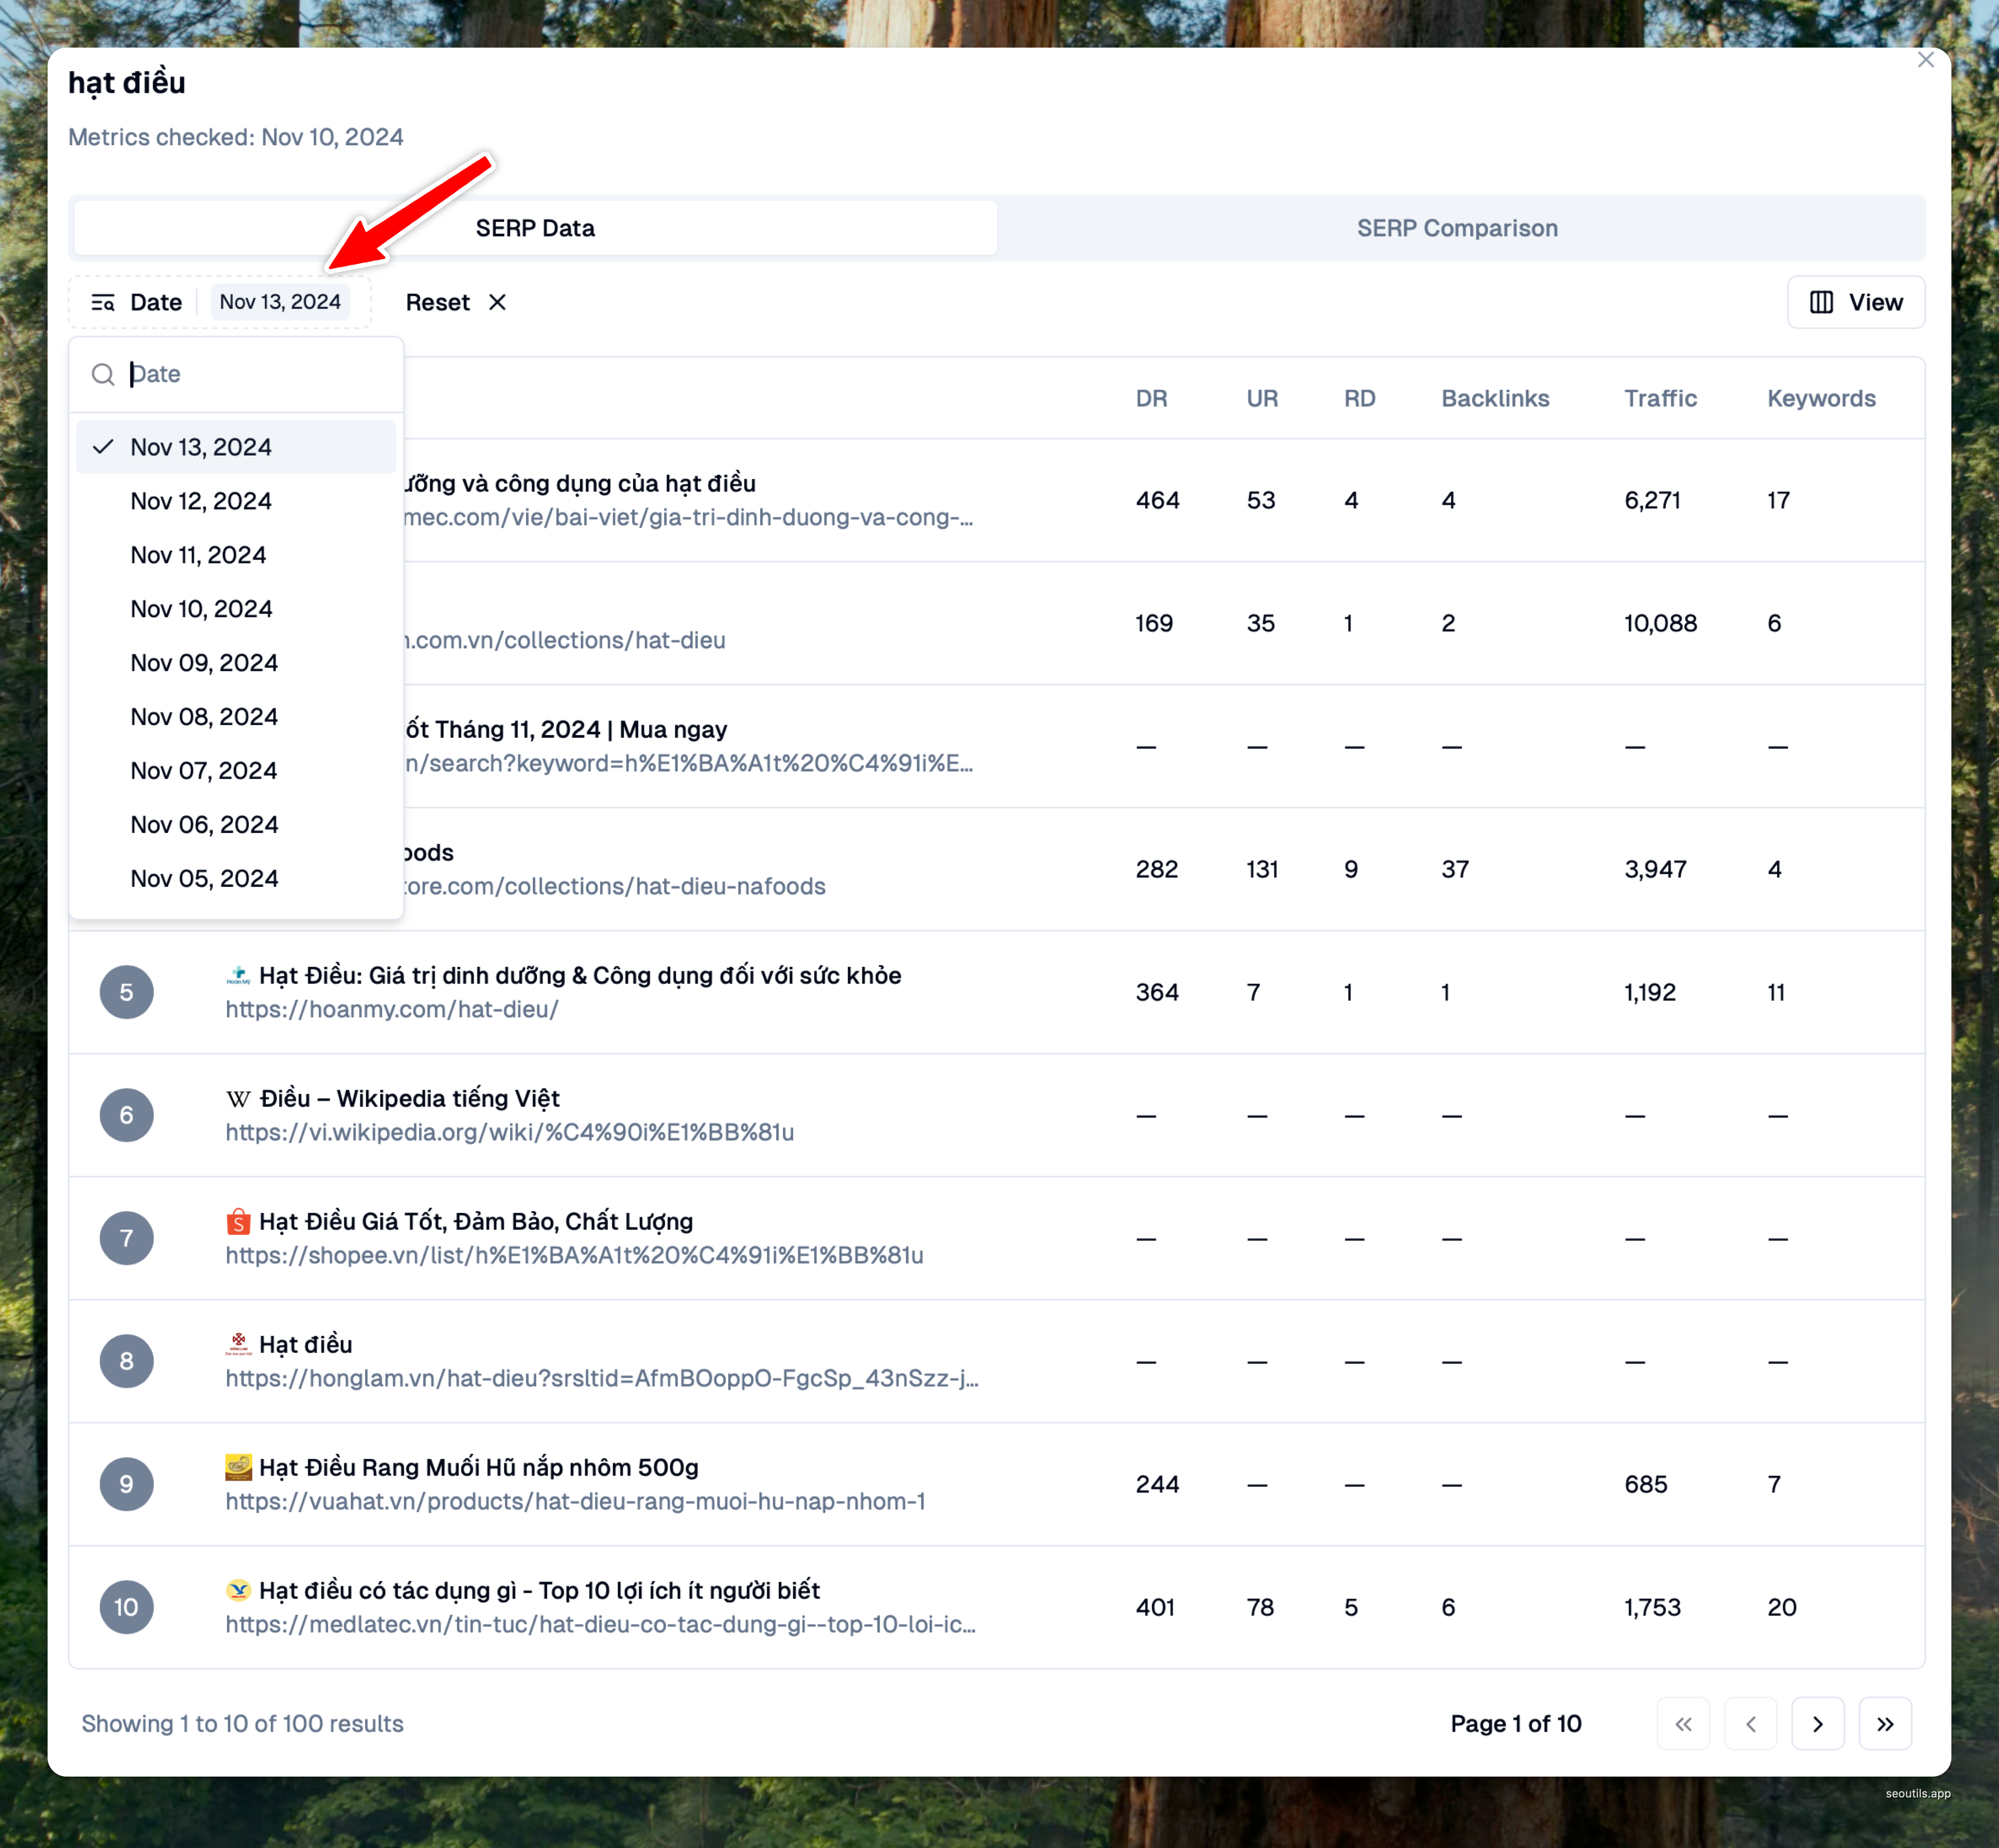
If you'd like to view the SERP data for a keyword, simply click on the SERP button next to it.

You can view the historical SERP data by using the Date filter.

SERP Features Tracking
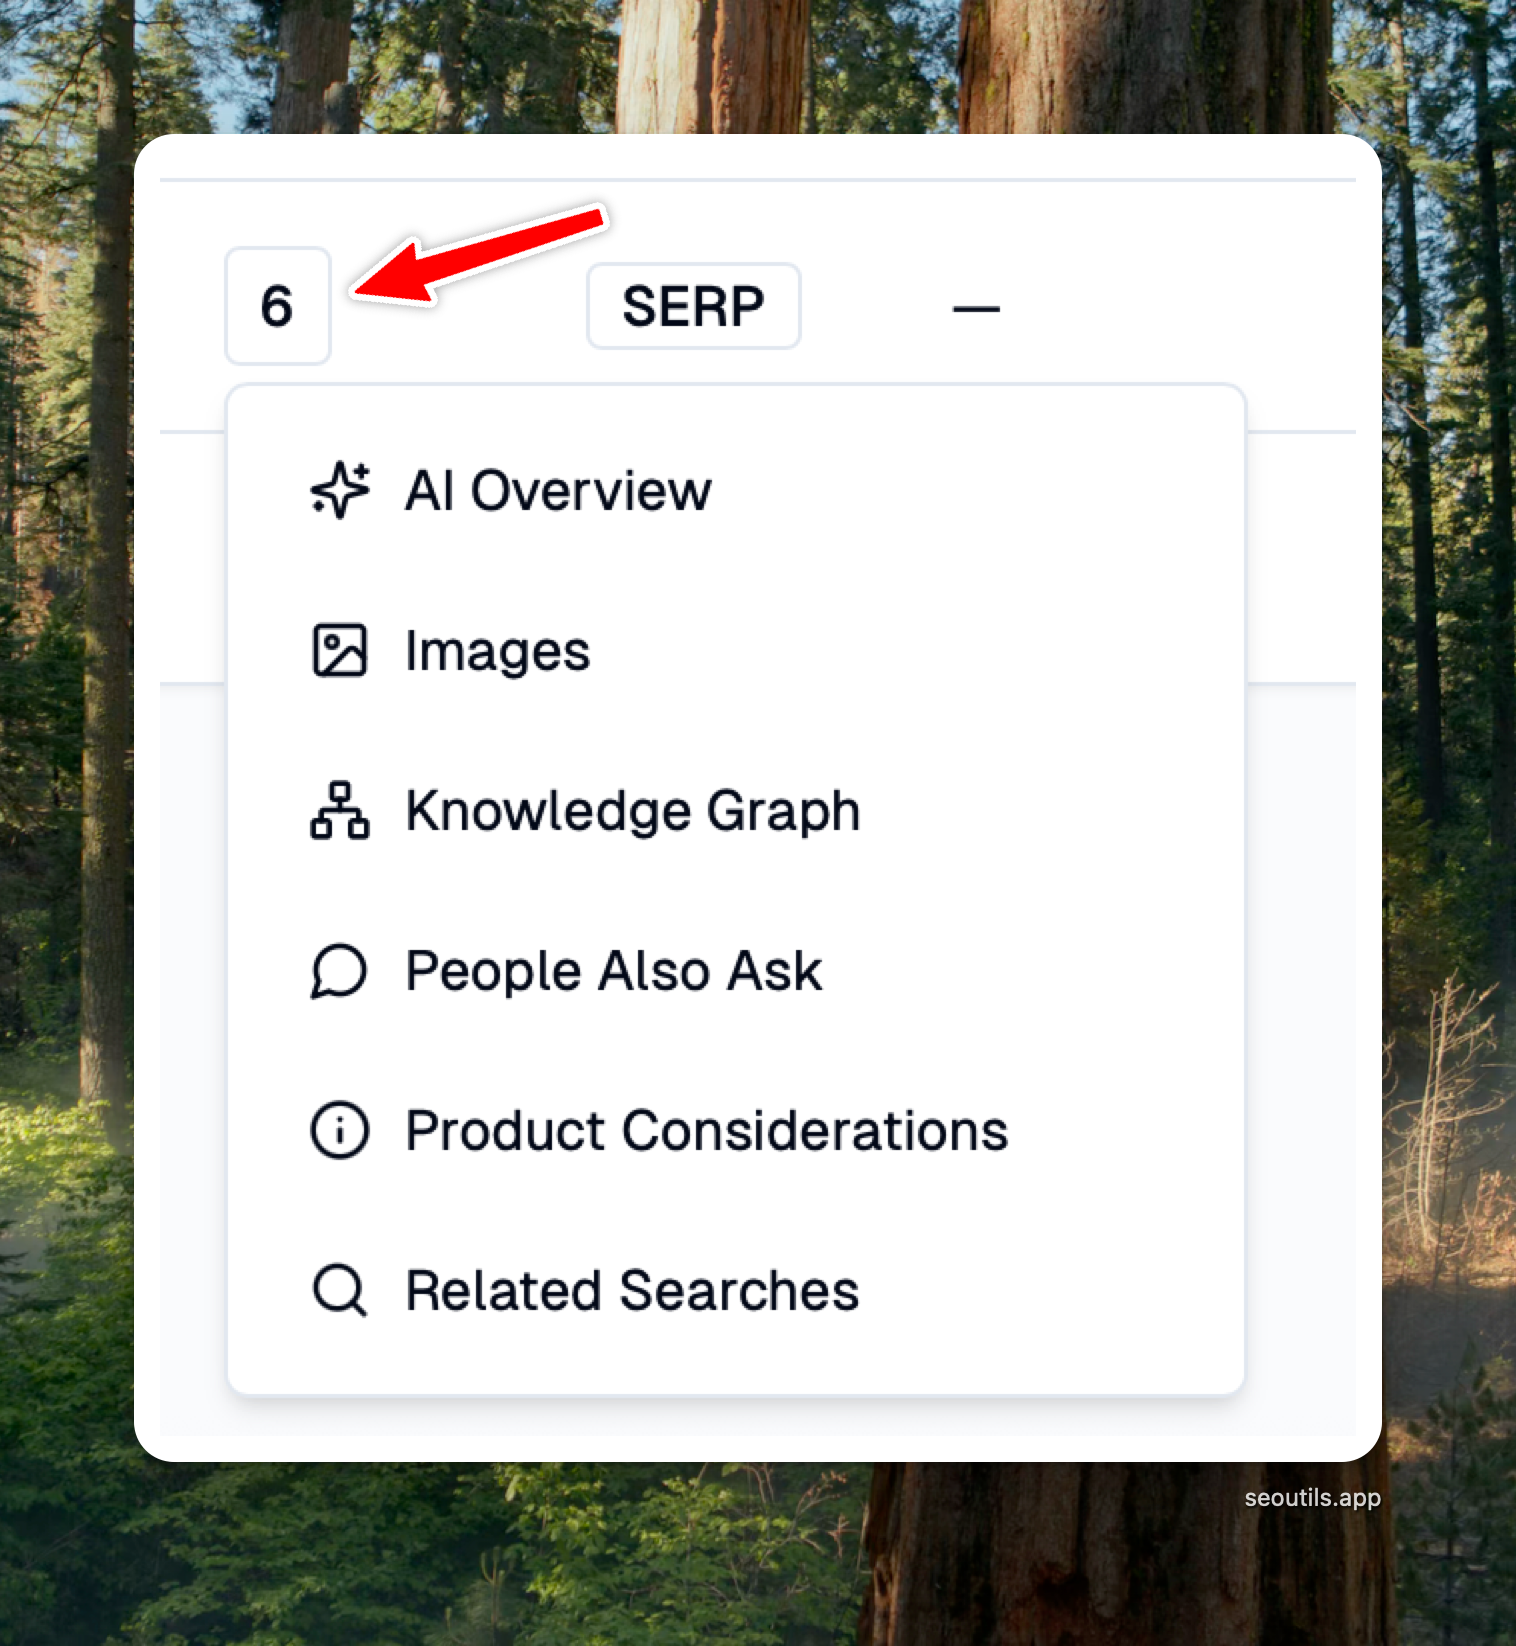
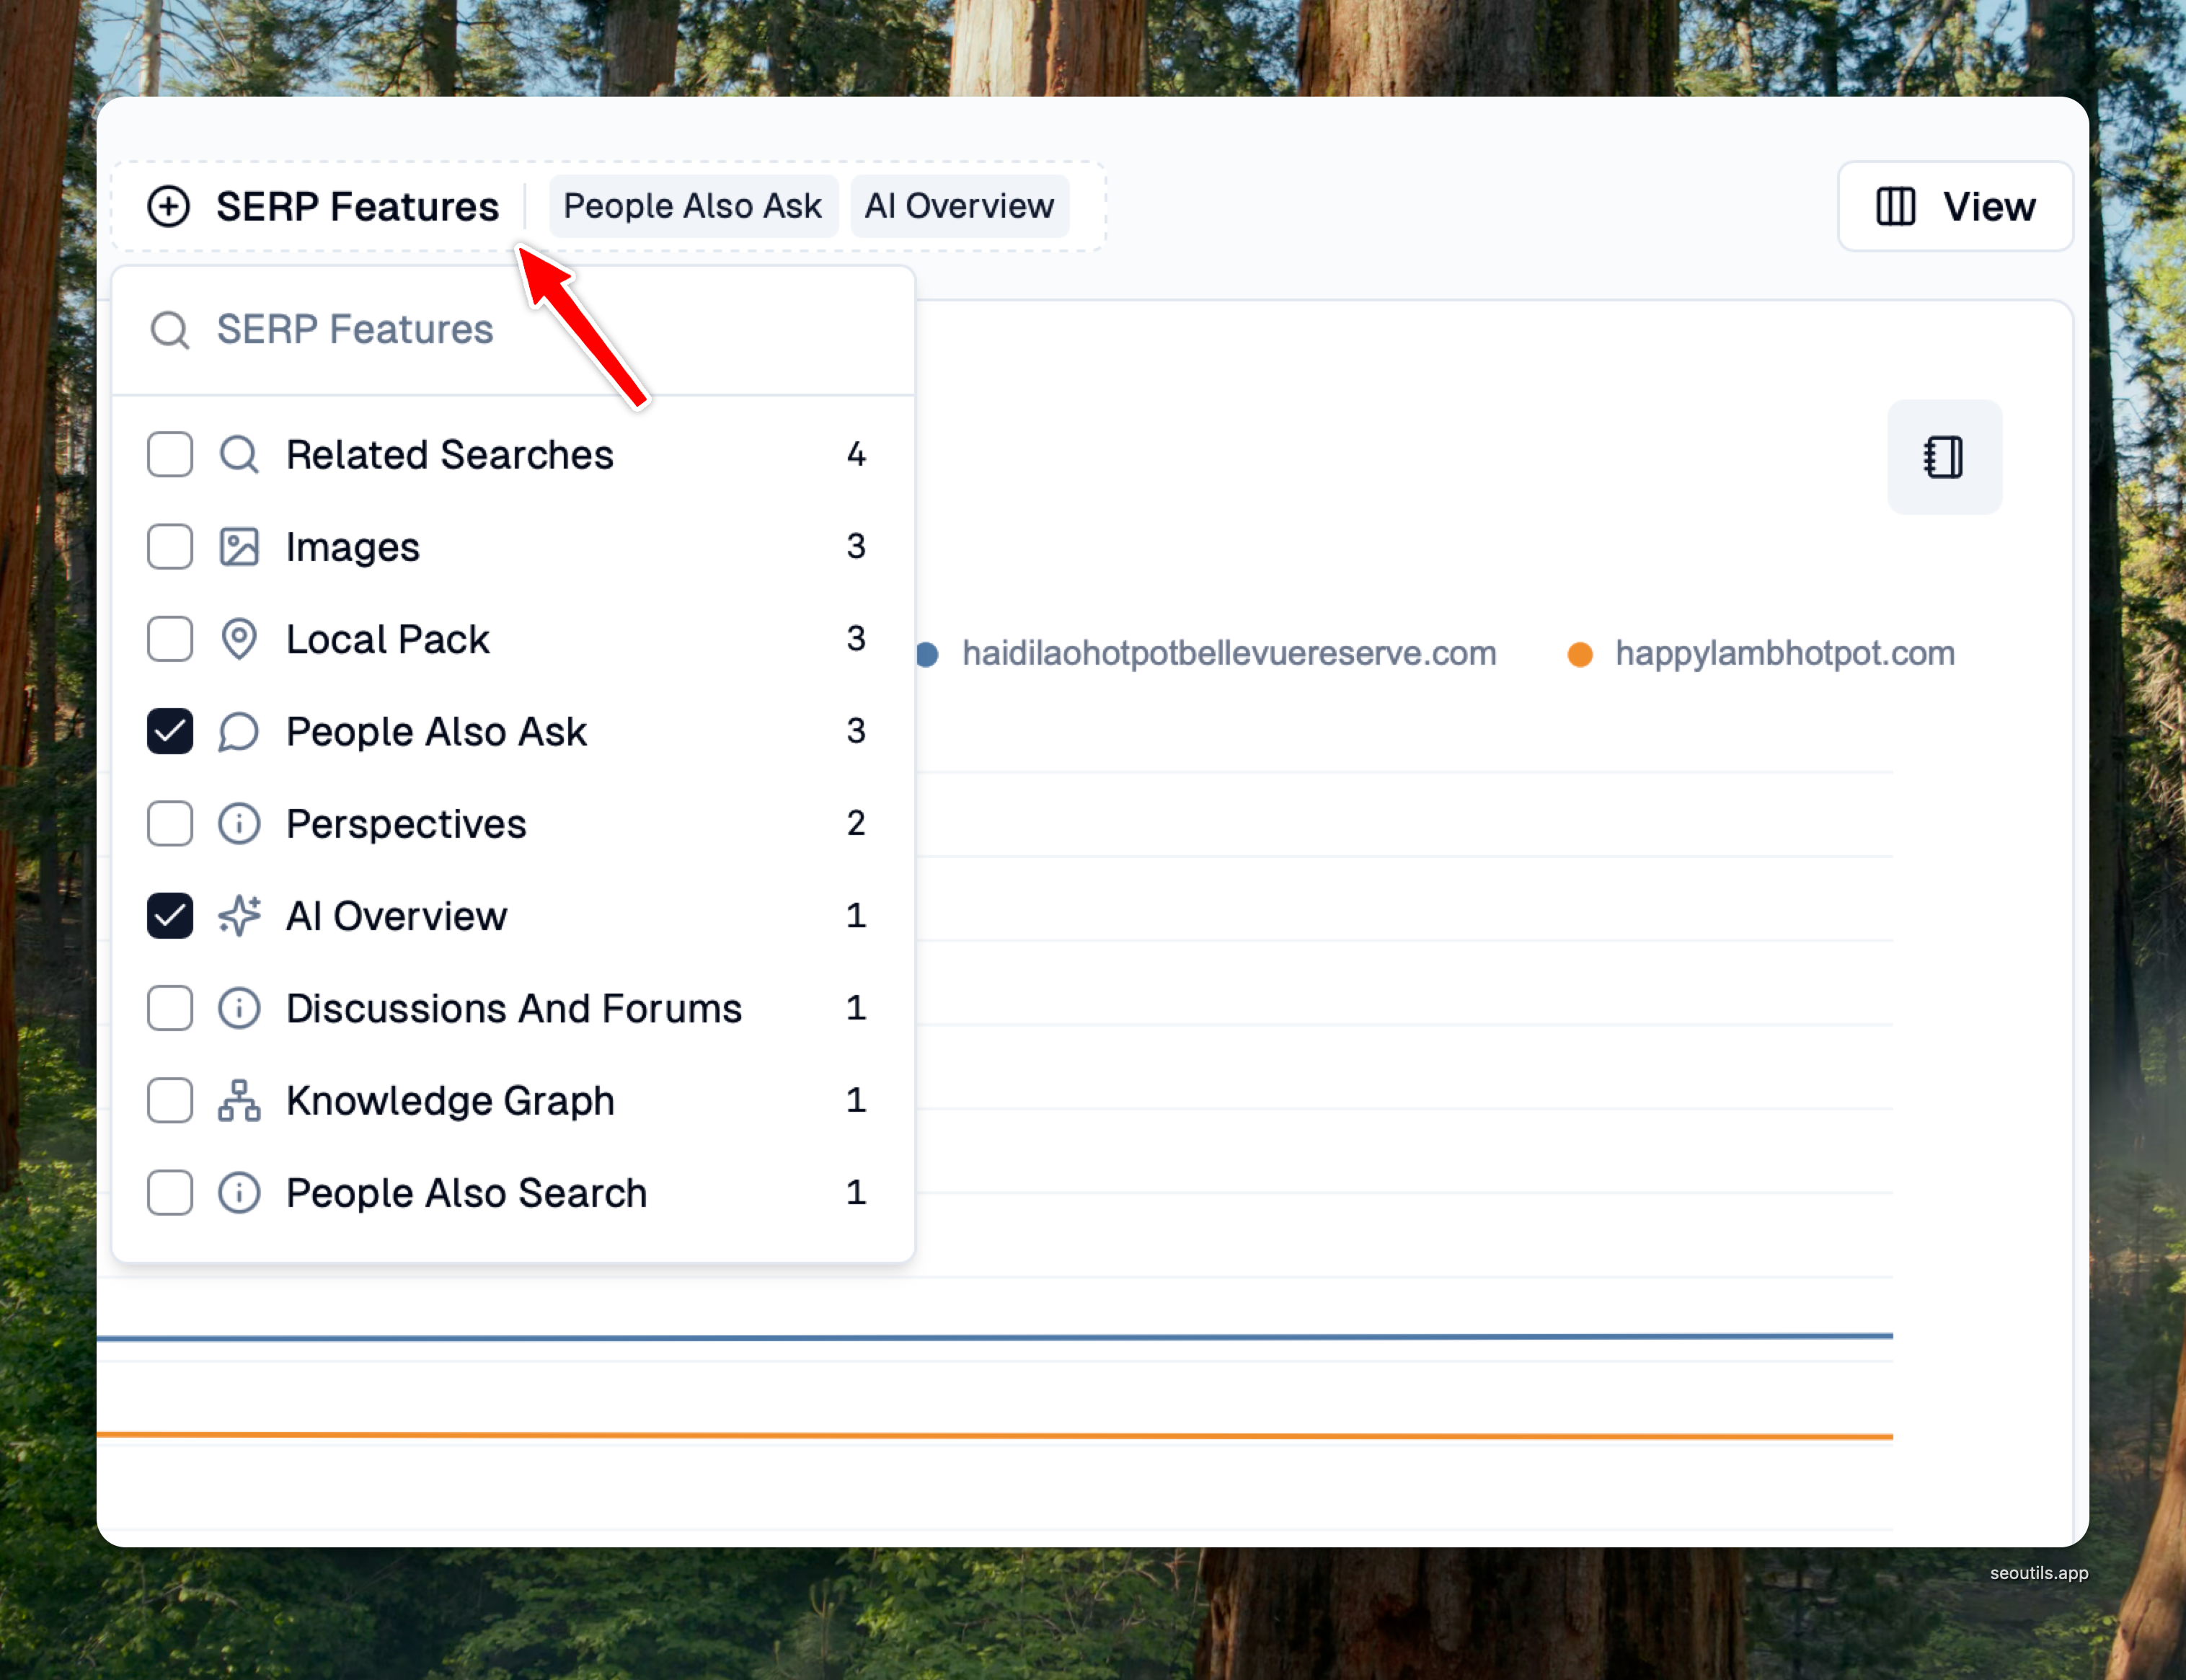
SEO Utils now tracks various SERP features that appear alongside organic results. The SF (SERP Features) column shows how many special features appear for each keyword.
Tracked SERP Features Include:
Local Pack - Top 3 local business results with map
Featured Snippet - Answer box at the top of results
Knowledge Panel - Information box about entities
AI Overview - AI-generated summaries
People Also Ask - Related questions section
Shopping - Product listings
Video - Video carousel
News - News articles
Images - Image pack
And more...
Click on the number in the SF column to see which specific features appear for that keyword.

You can also use the SERP Features filter to find keywords that trigger specific features, helping you optimize for these valuable SERP positions.

Local Pack Advantage
When your business appears in the Local Pack, it's displayed with a πΊοΈ map pin icon. These positions are extremely valuable as they:
Appear at the very top of search results
Include rich information (reviews, address, hours)
Link directly to your Google Maps listing
Drive both online visibility and foot traffic
PAA Source Tracking
When PAA Click Depth is enabled on the report (see the configuration section above), SEO Utils detects whether your target domain β or any of your competitors β is featured as a source inside Google's People Also Ask box. This is a separate signal from organic ranking and from the "PAA box appeared on the SERP" SF flag.
The purple PAA badge
In the Overview tab, a small purple PAA badge appears next to the diff cell whenever the corresponding domain has at least one PAA source appearance for that keyword. The number on the badge is the appearance count.

Hover the badge for a tooltip showing the count, or click it to open the SERP slideover with the full list of PAA questions and source URLs grouped by domain.

Filtering by PAA presence
A new "[Your Domain] in PAA" filter sits next to the SERP Features filter. Two values:
Featured in PAA β keywords where your target domain has at least one PAA source appearance in the selected date range.
Not featured in PAA β keywords where your target domain has zero PAA source appearances. Useful for finding PAA opportunities: the box exists for the keyword, but you're not the source β so you can write content targeting those questions.

How matching works: SEO Utils normalizes the source domain returned by DataForSEO (stripping the www. prefix) before matching against your tracked domains. So adding kentucky.com as a competitor will match PAA sources Google attributes to www.kentucky.com. Real subdomains like blog.example.com still require Include Subdomains to be enabled on the report.
Reality check on PAA sources: Google increasingly answers PAA questions with AI Overview content instead of citing a single source URL. When this happens, DataForSEO returns the question but no source domain β so no badges fire even though the PAA box appeared. This is a Google trend, not a tracking gap on our side. Coverage varies by query.
Pixels From Top Display
When Track Pixels From Top is enabled on the report, every rank cell in the Overview tab shows a small px value next to the position number. This is the vertical pixel offset of the snippet from the top of the SERP β lower numbers mean better real-world visibility.

A dedicated Pixels Diff column also appears alongside the existing Diff column, showing how the pixel offset changed between the From and End dates. Color coding follows the same convention as rank diff:
Green β the snippet moved up the page (fewer pixels from top) β improved visibility.
Red β the snippet moved down the page β worse visibility, even if organic rank stayed the same. This is what usually happens when Google adds new SERP features above your result.
New / Lost β the snippet appeared for the first time or disappeared between the two dates.
Hover the px value to see the exact pixel offset in a tooltip.
Pixel data for competitors works automatically. When you add a competitor to a tracker with Track Pixels From Top enabled, SEO Utils backfills pixel offsets for that competitor across every existing snapshot β no re-scrape needed, no extra cost. The pixel data was already captured in the SERP cache during the original scrapes; adding a competitor just reads it back out for that domain. Each competitor row in the Overview grid gets its own Pixels Diff column.
Not every position gets a pixel value. DataForSEO only emits rectangle coordinates for snippets that were laid out within the rendered viewport. Results deeper on the page (typically beyond position ~10β15) and certain SERP item types may have no pixel measurement attached β the column simply shows the rank without a px value. This isn't a bug; the data just isn't part of DataForSEO's response.
You can also switch to the SERP Comparison tab. That tool allows you to instantly view side-by-side SERP results for any keywords to easily spot trends and competitors.
Rerun the Tracker
You can rerun the tracker at any time. This is particularly useful when you need to check the keyword ranking on-demand, without relying on a scheduled run.

When you re-run the tracker, SEO Utils only scrapes SERP data for keywords missing current date information. This helps save time and costs.
Run Partial Scan
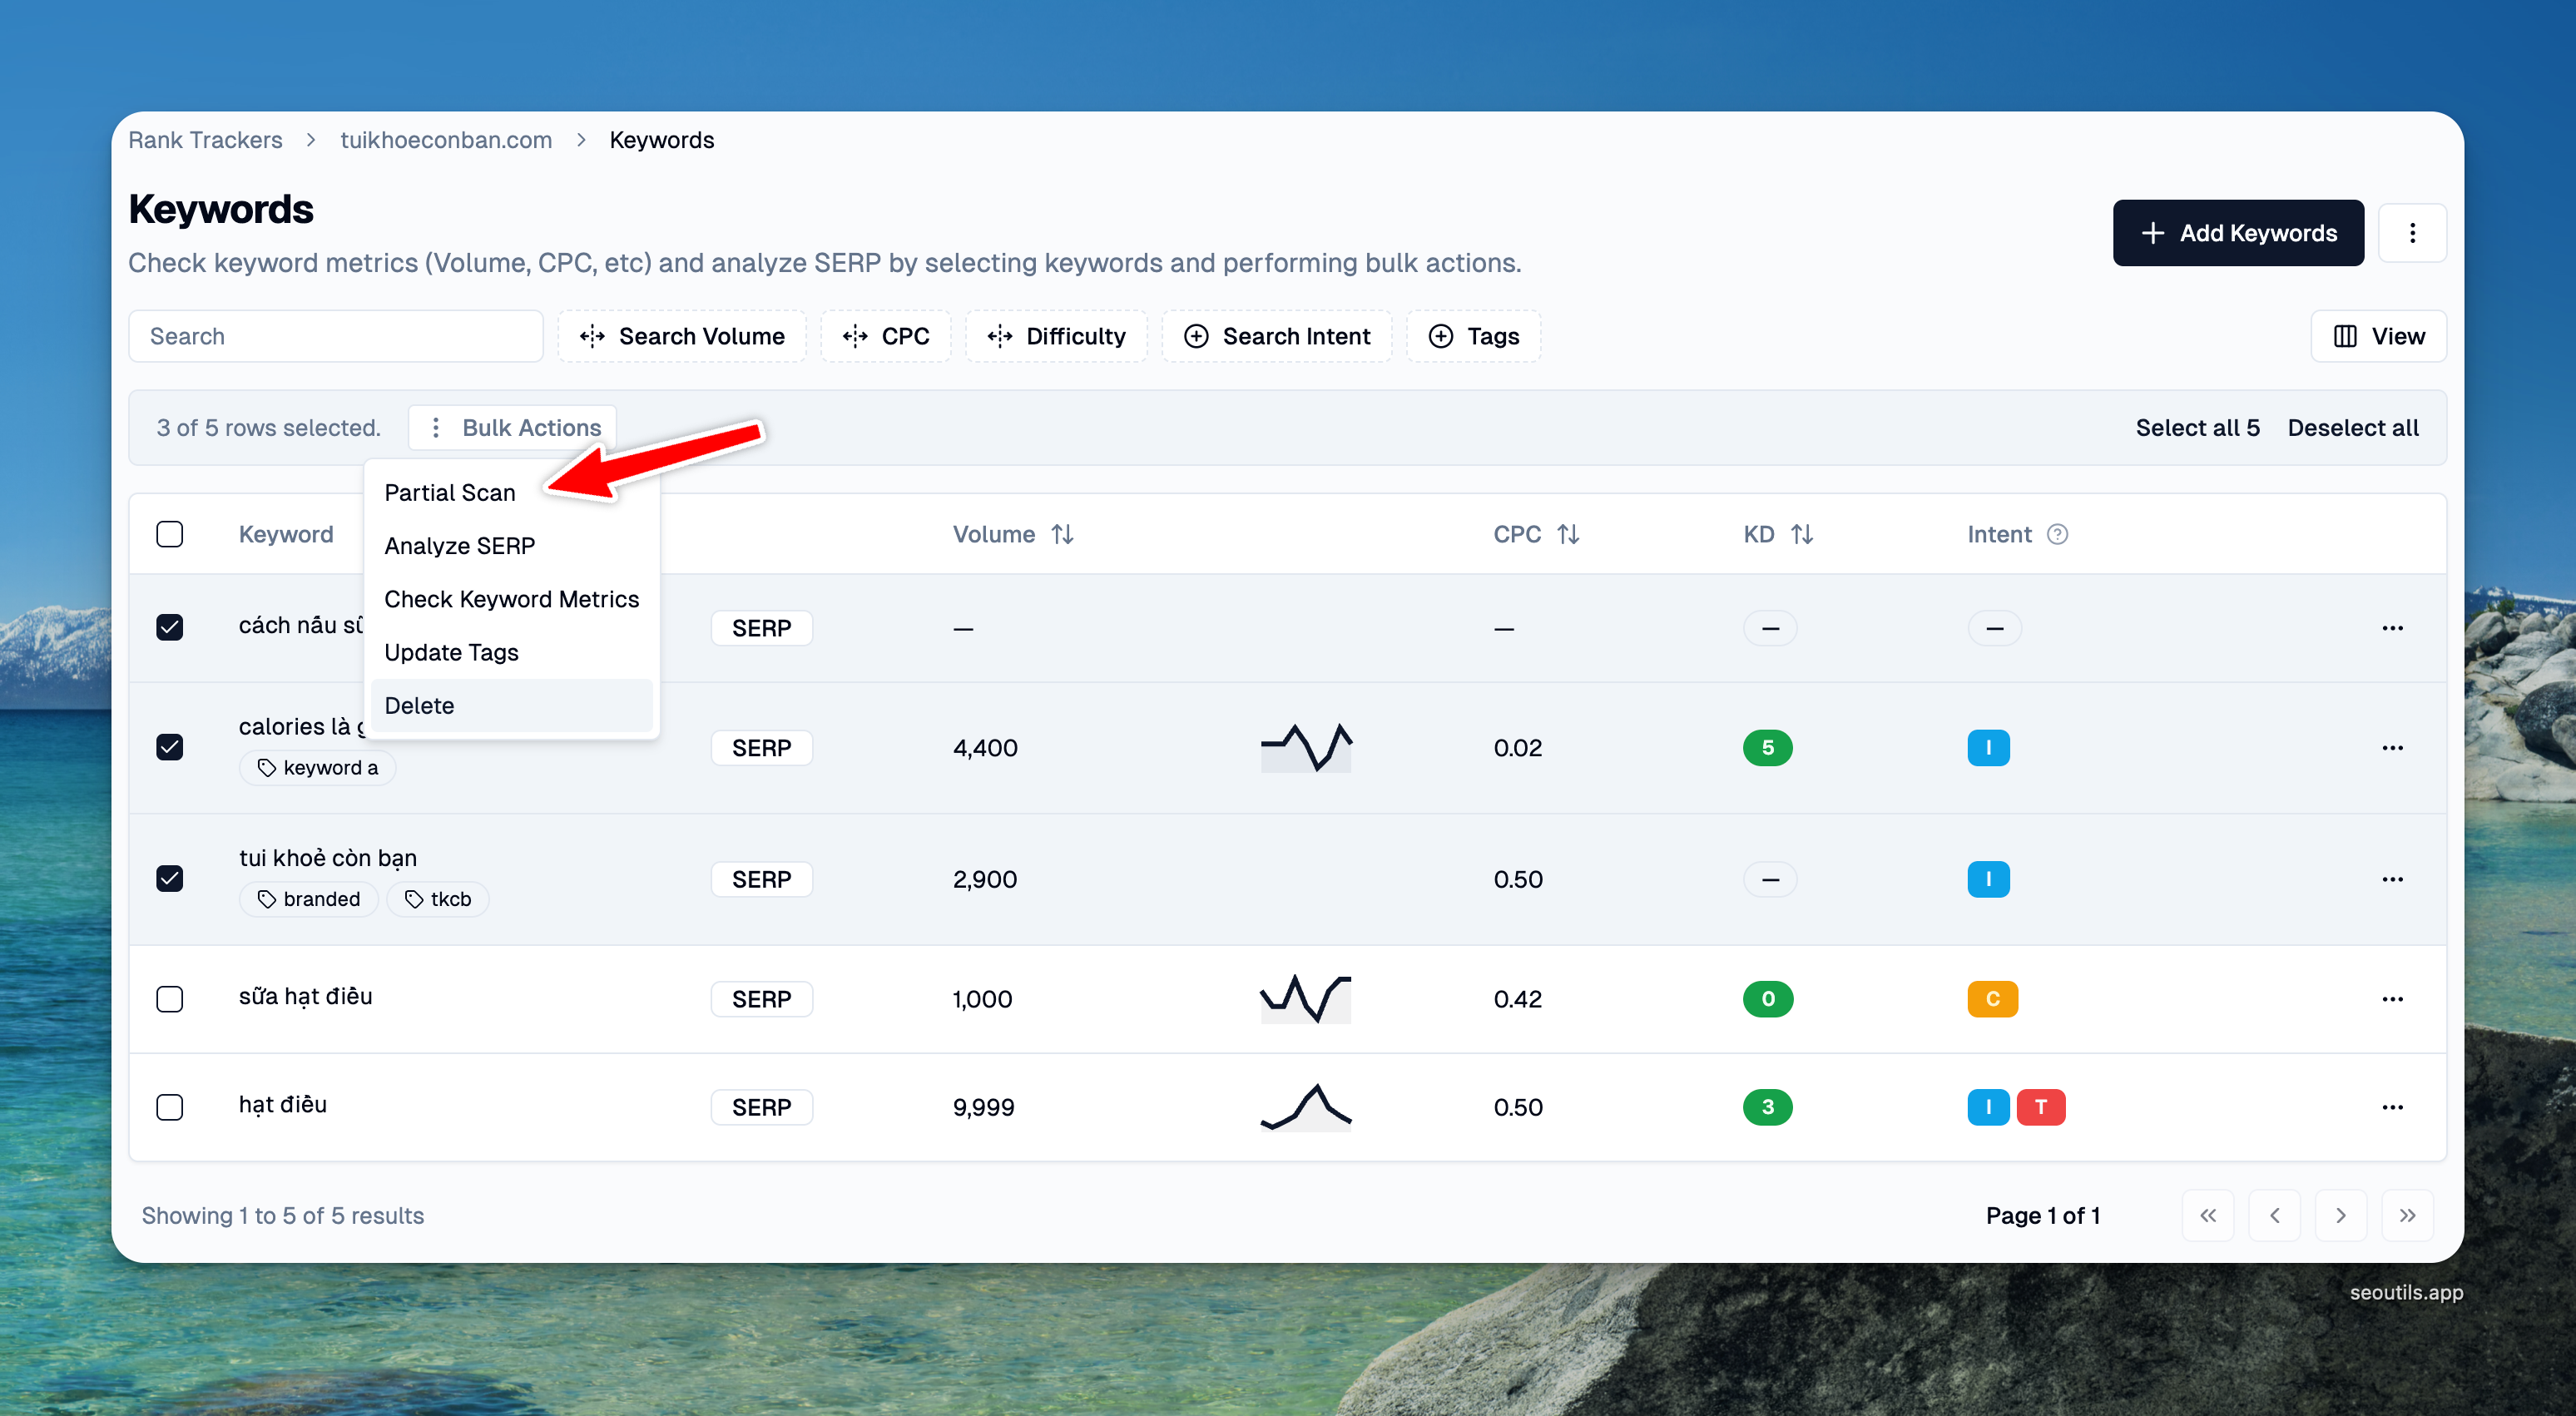
For advanced users who need more control over which keywords to scan, SEO Utils offers a Partial Scan feature. This allows you to select specific keywords and update only their rankings, while preserving the existing ranking data for other keywords.
How to run a partial scan:
Navigate to the Keywords management page by clicking on the keyword count
Select the specific keywords you want to scan
Click the "Run Partial Scan" bulk action

Understanding Stale Data:
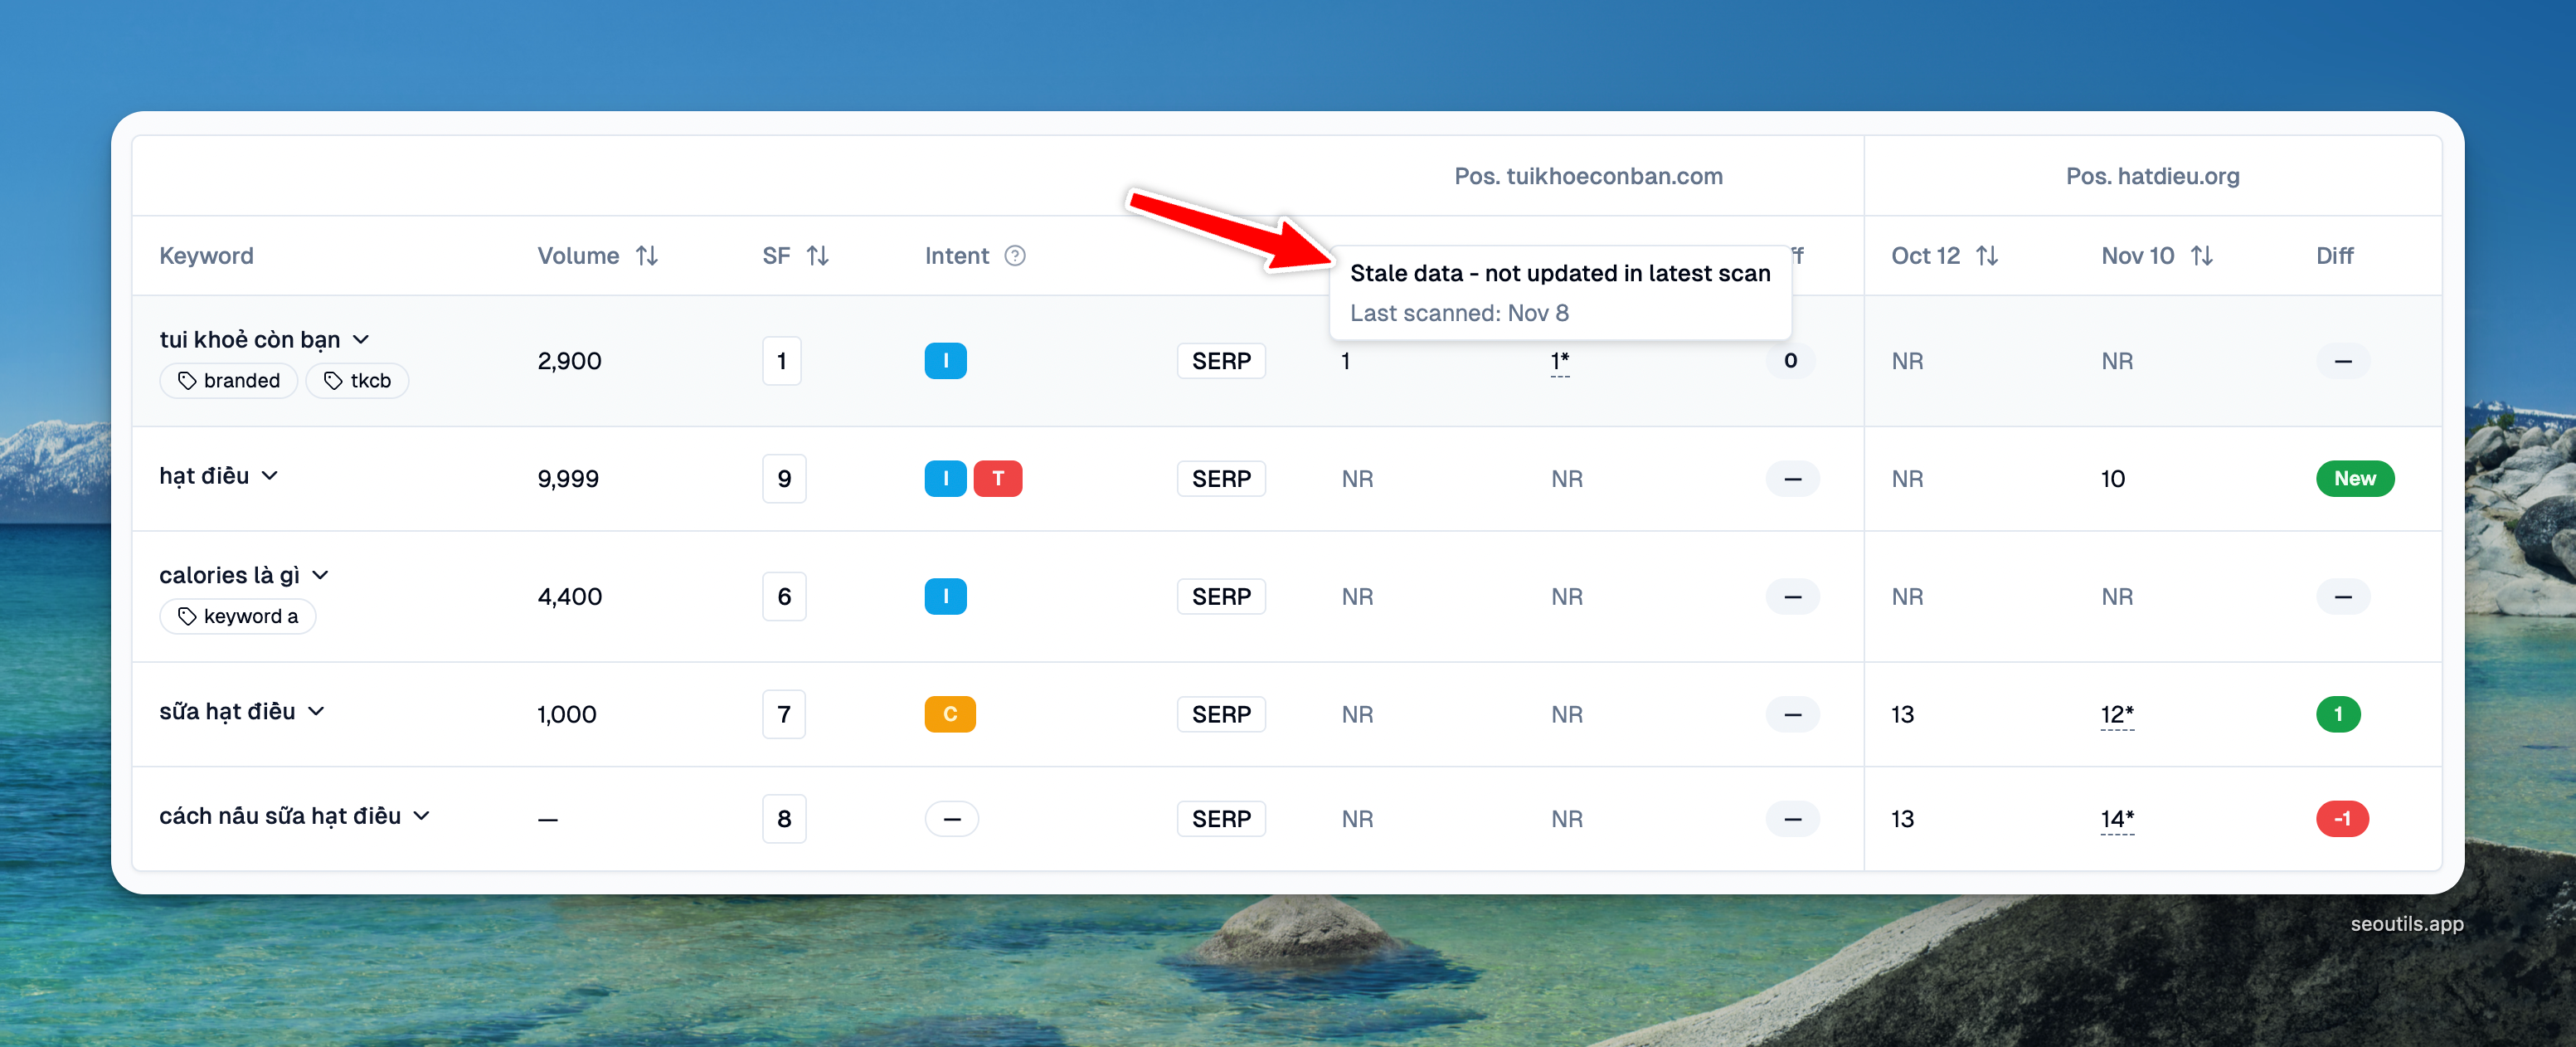
When you run a partial scan, only the selected keywords get fresh SERP data. Keywords that weren't included in the scan will show their last known positions with a stale data indicator (β οΈ icon).
Hovering over the stale indicator shows when that keyword was last scanned. This helps you identify which keywords have current data versus which ones are showing historical positions.

Important: Partial Scan Best Practices
We recommend only using partial scans when you have disabled the schedule (set "Rerun Every" to 0 days).
Here's why: If you have scheduled auto-runs enabled and you run a partial scan on only some keywords, the next scheduled run will automatically scan all keywordsβincluding the ones you didn't include in your partial scan. This could lead to unexpected SERP API costs or proxy usage.
Annotations

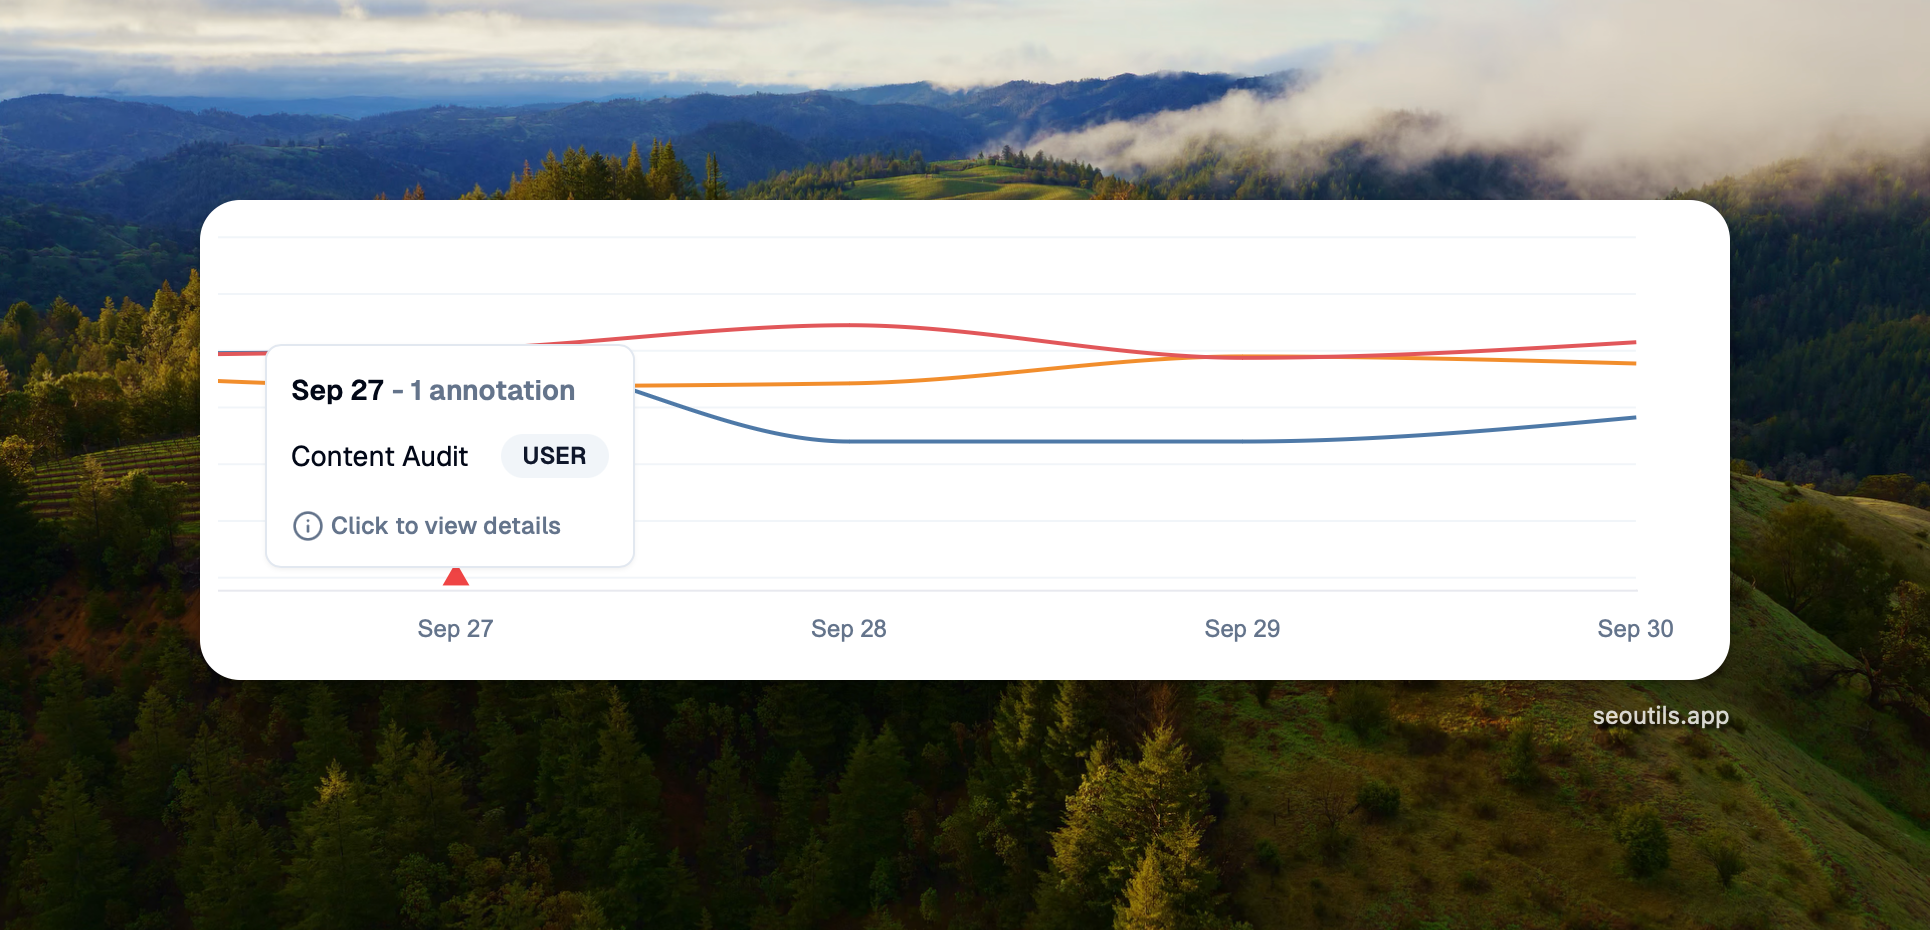
This feature let you highlight key events or changes in your data. For instance, if youβve just wrapped up a major content audit, you can mark that event on the chart to track its impact on your rankings.
When adding new keywords, SEO Utils creates a System annotation to indicate the date you added those keywords.
You can watch this video to see how to manage annotations.
Pages Tab
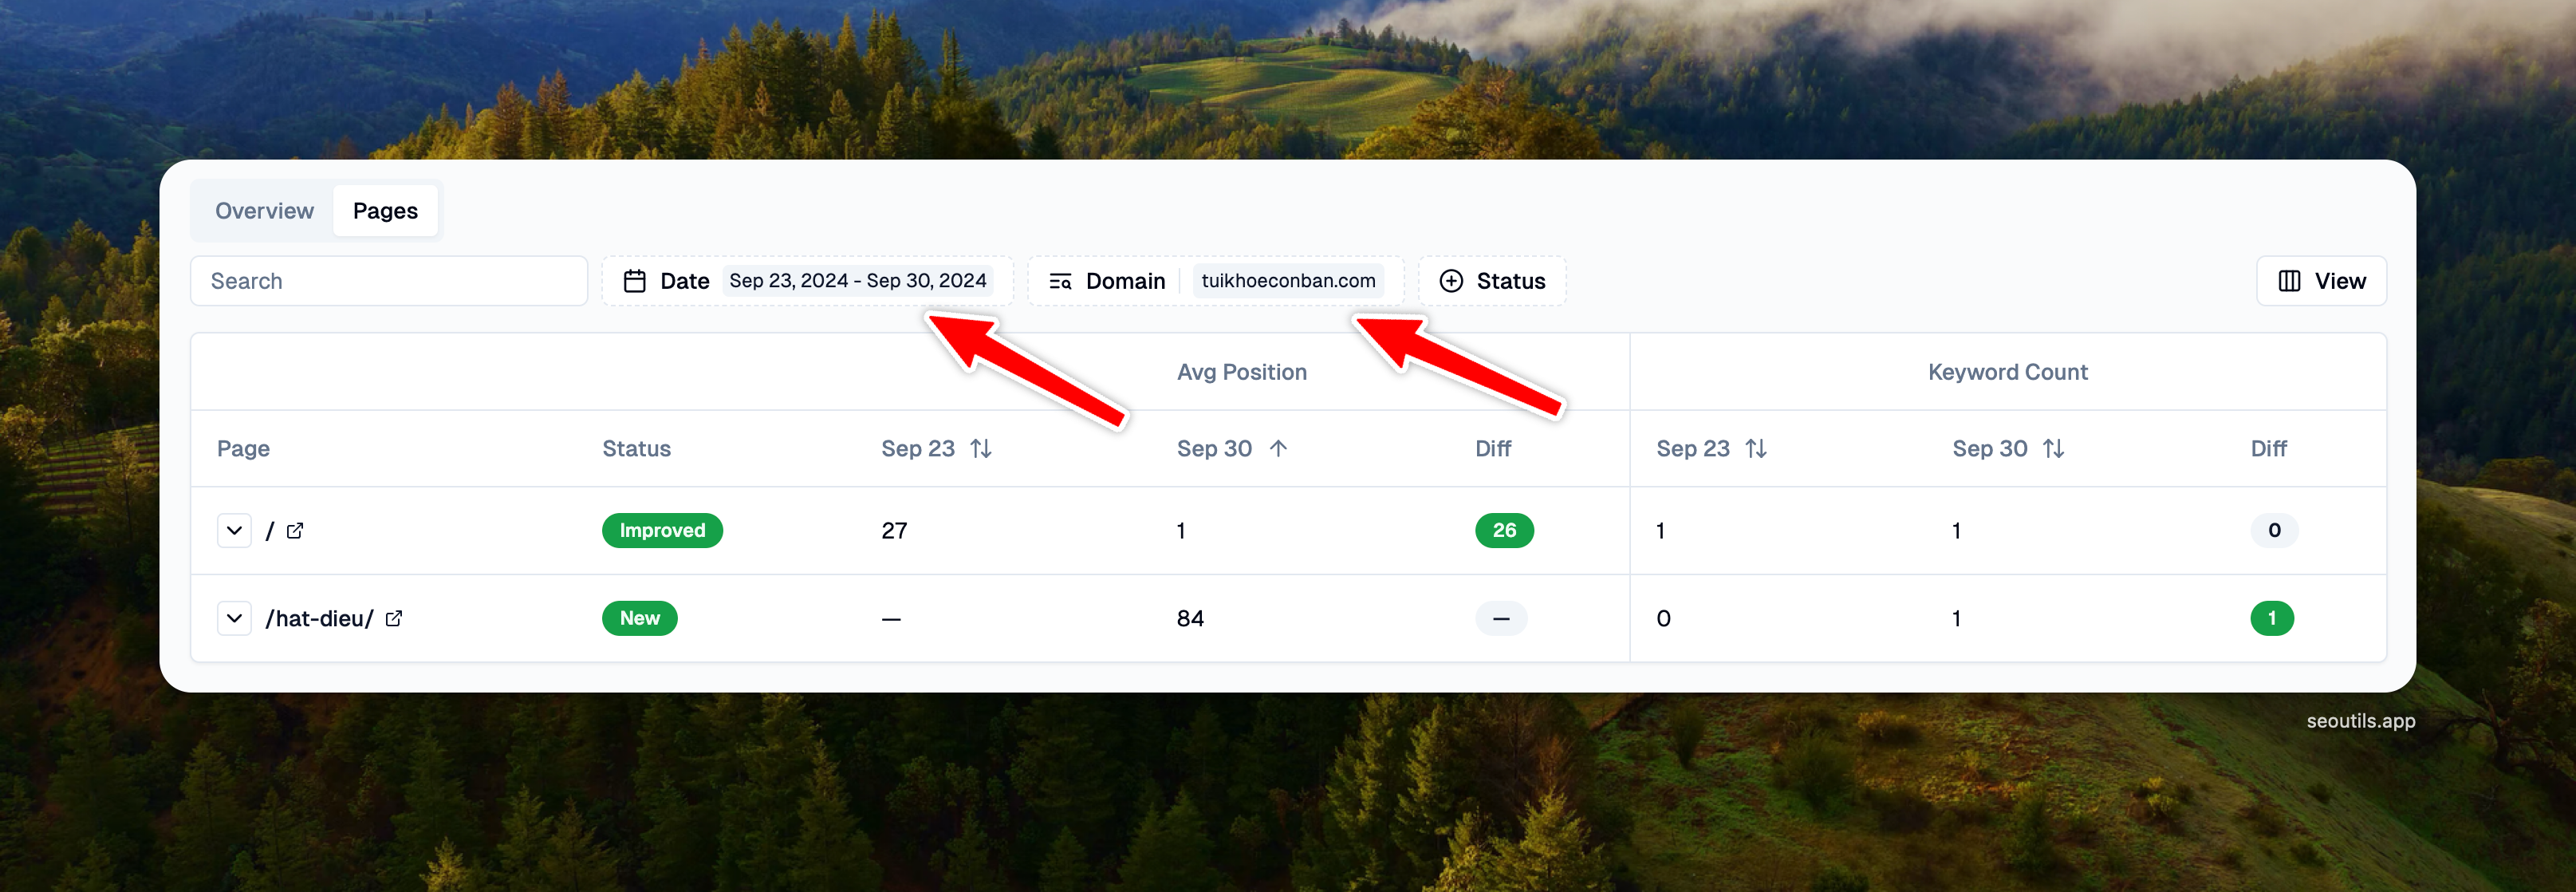
You can see all the ranked pages in this tab. Like the Overview tab, you can filter by Dates or Competitors.

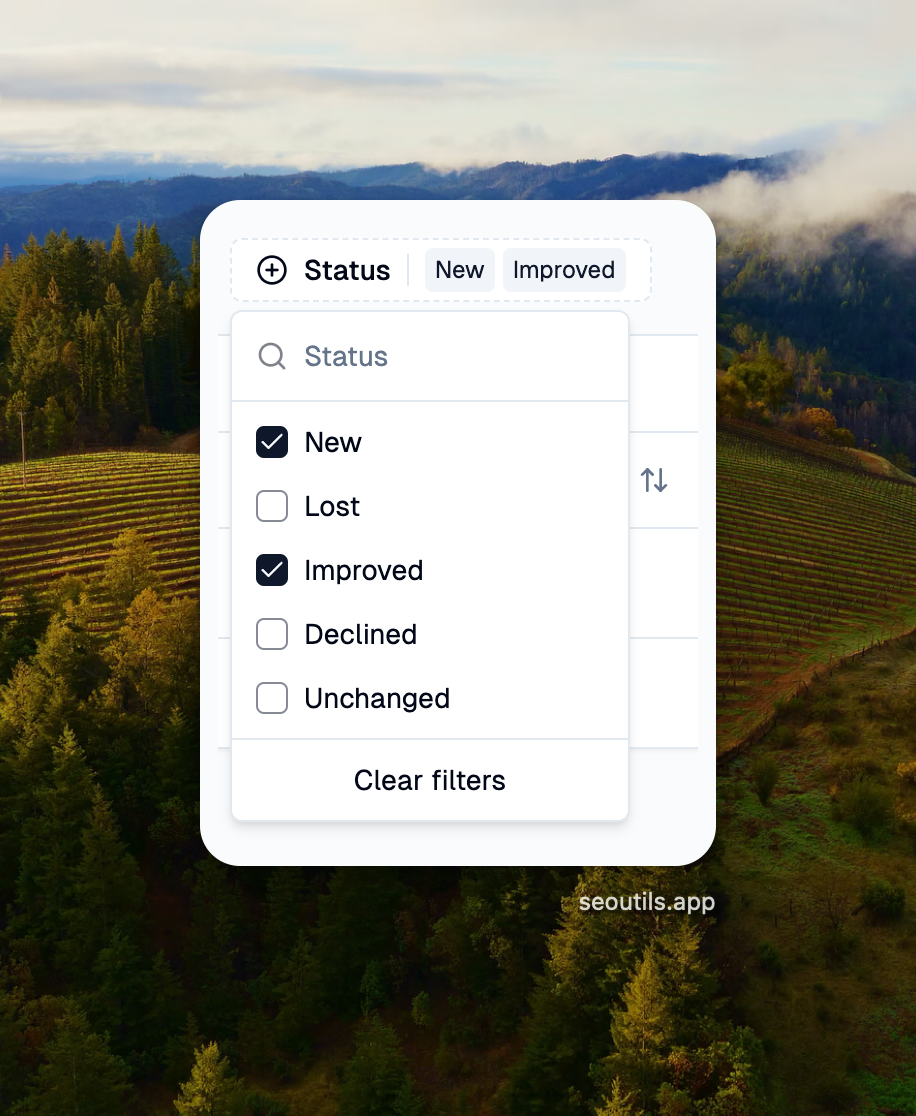
The Status column displays the ranking status of each page. You can filter based on this column. This is particularly useful for identifying good or bad performing pages within a specific date range.

You can also filter the pages with the status "Unchanged" to improve their ranking.
Important to know
New: Keywords that have no ranking on the From date but have a ranking on the End date
Lost: Keywords that have a ranking on the From date but no ranking on the End date
Improved: Keywords that have moved up in ranking position between the From date and End date
Declined: Keywords that have moved down in ranking position between the From date and End date
Unchanged: Keywords that have maintained the same ranking position on both the From date and End date
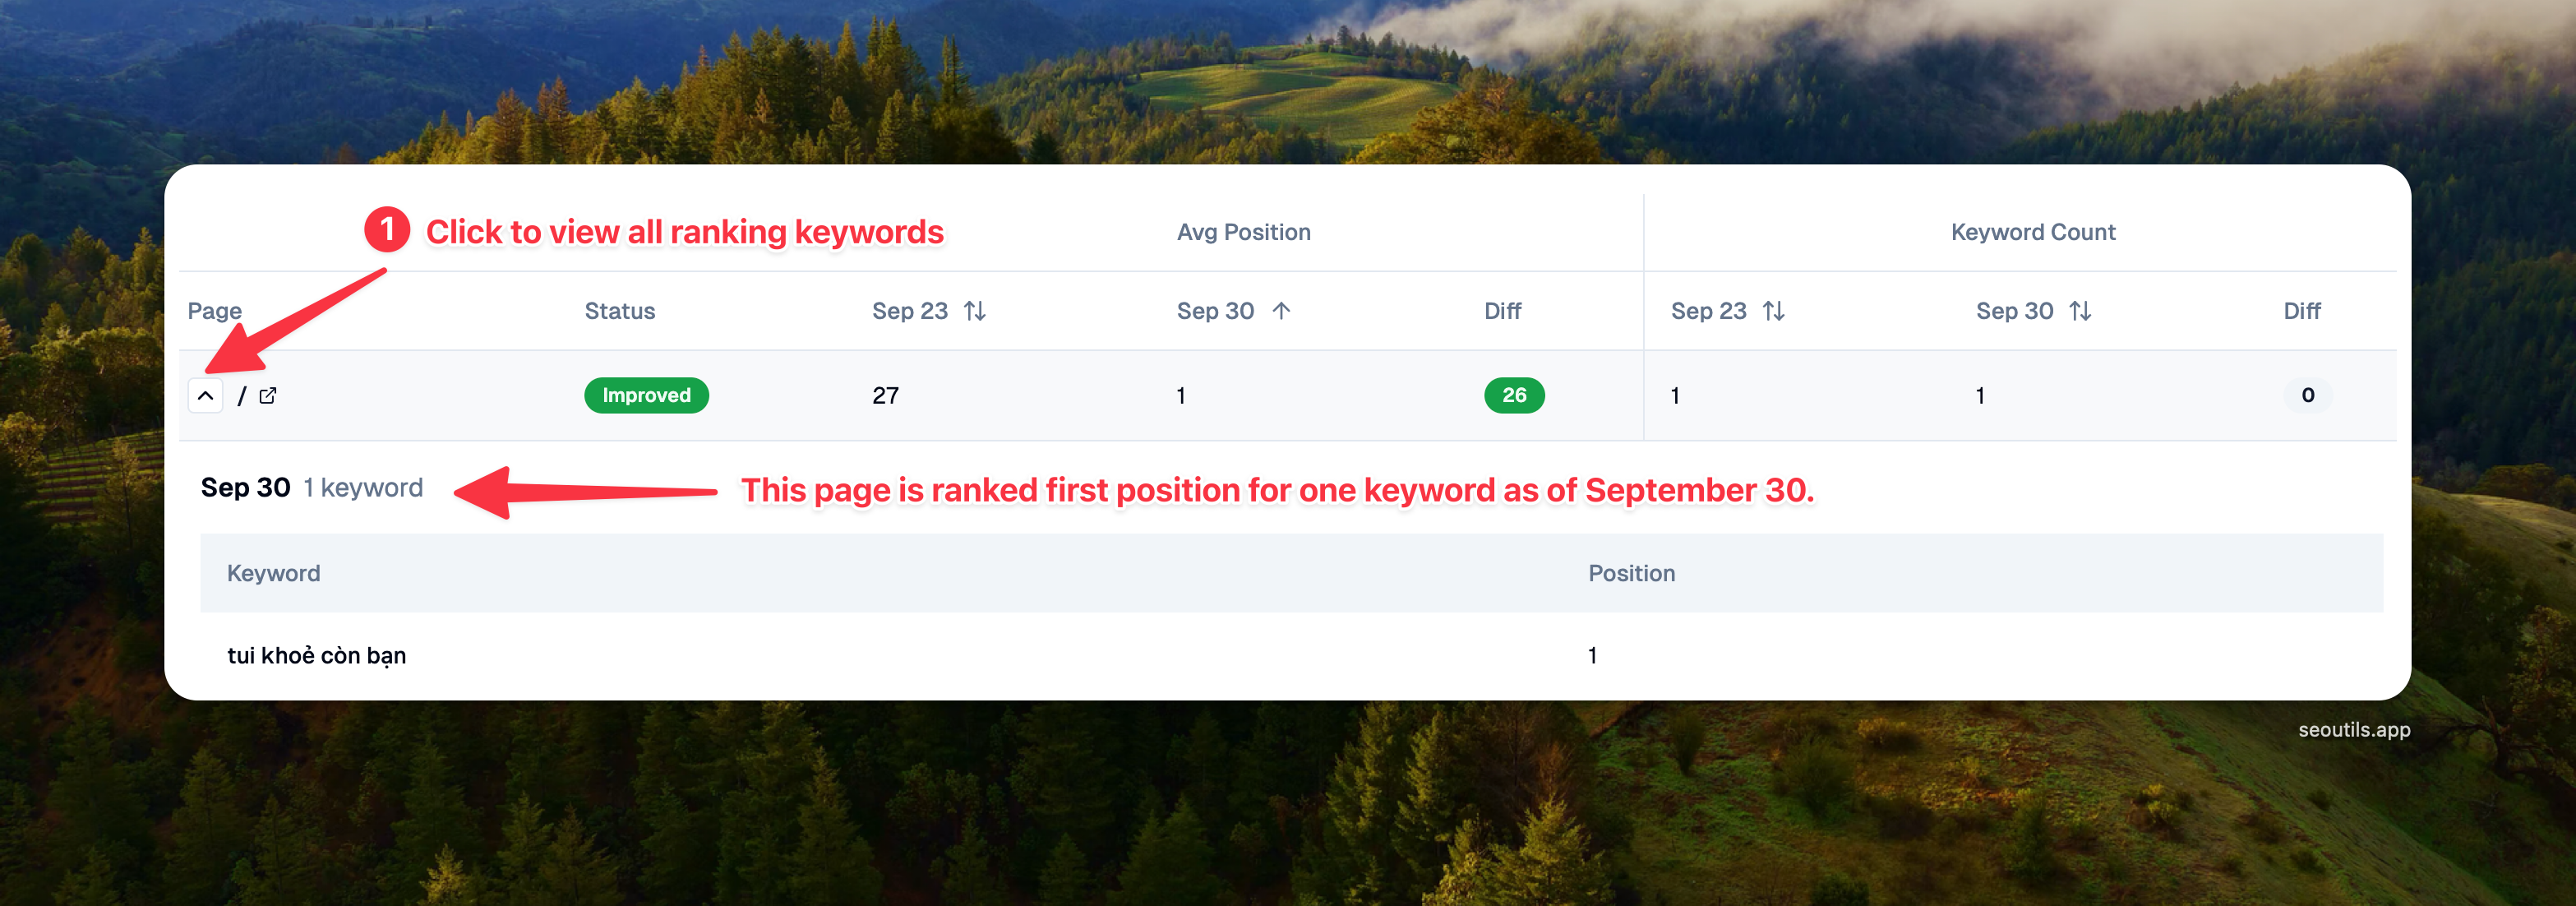
The Keyword Count column indicates how many keywords the page is ranking for. You can also click on the down arrow icon button next to the page URL to view all ranking keywords of that page.

Rankings Distribution Tab
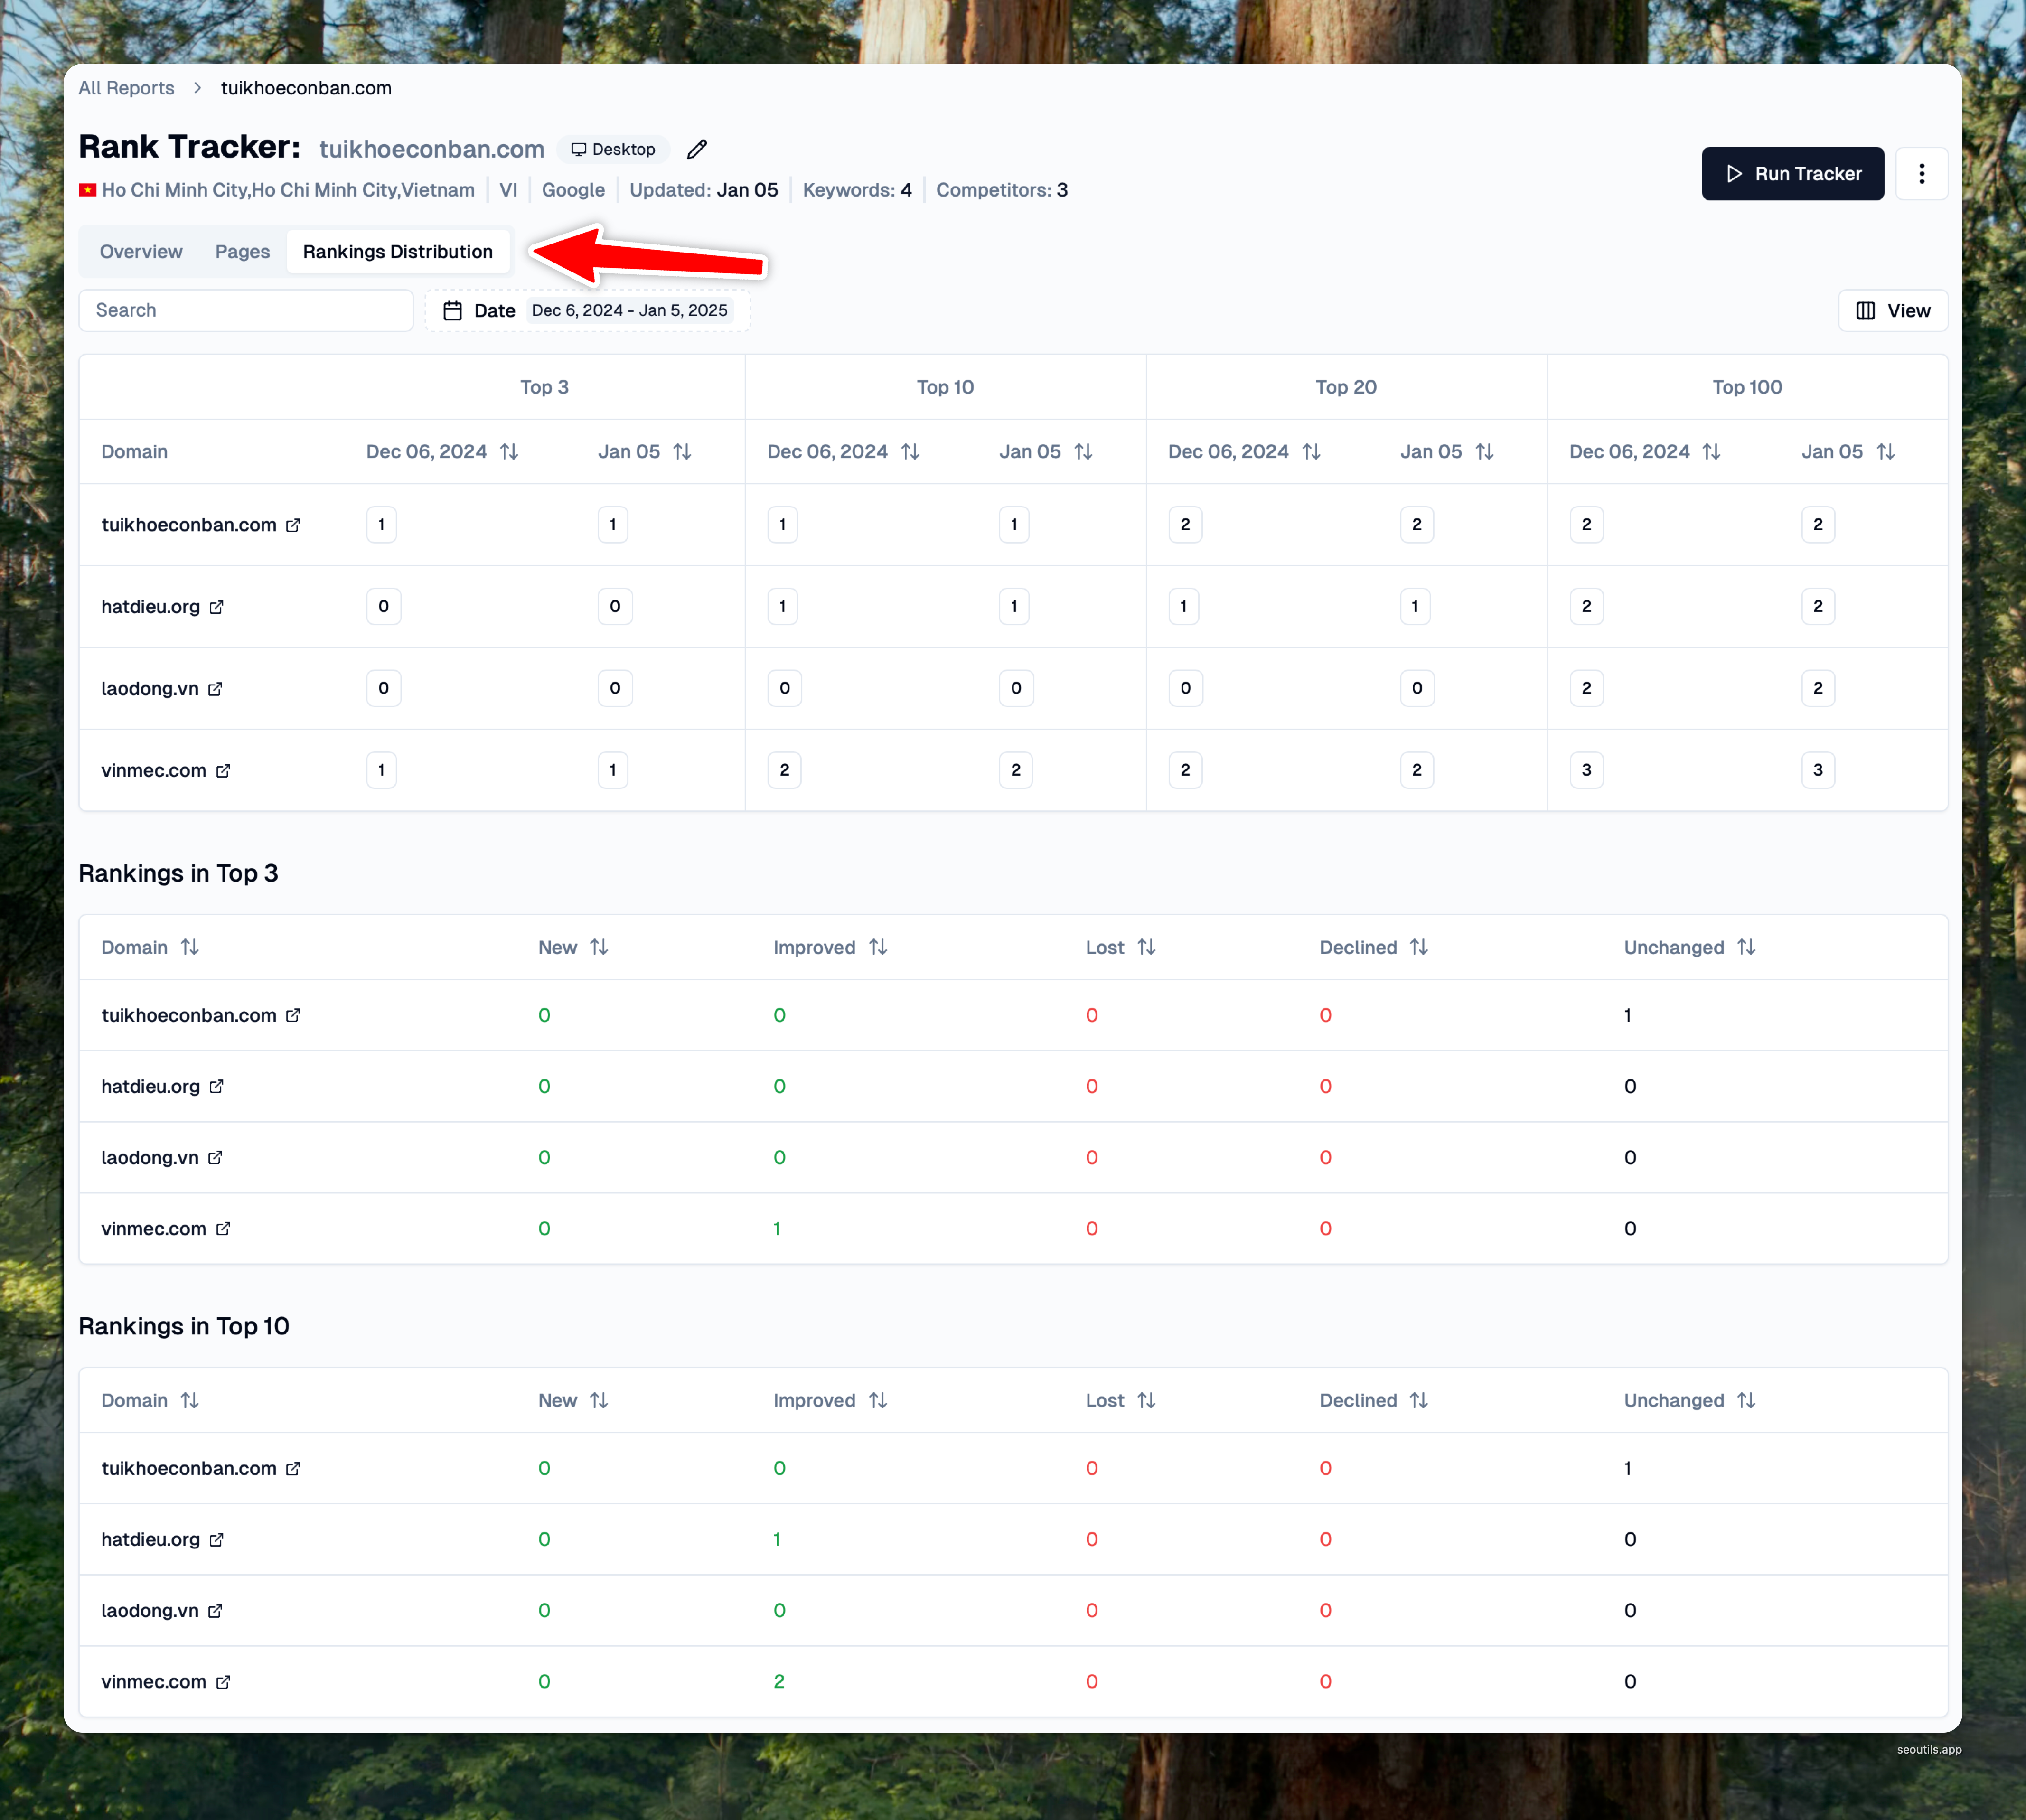
In v1.25.0, SEO Utils introduced a new report for the Organic Rank Tracker that provides a detailed ranking distribution analysis. This feature lets you see how many keywords your website or competitors rank in the top 3, top 10, top 20, and top 100.
For each ranking range, you can also track the number of keywords that are new, lost, improved, or declinedβgiving you valuable insights into performance trends.

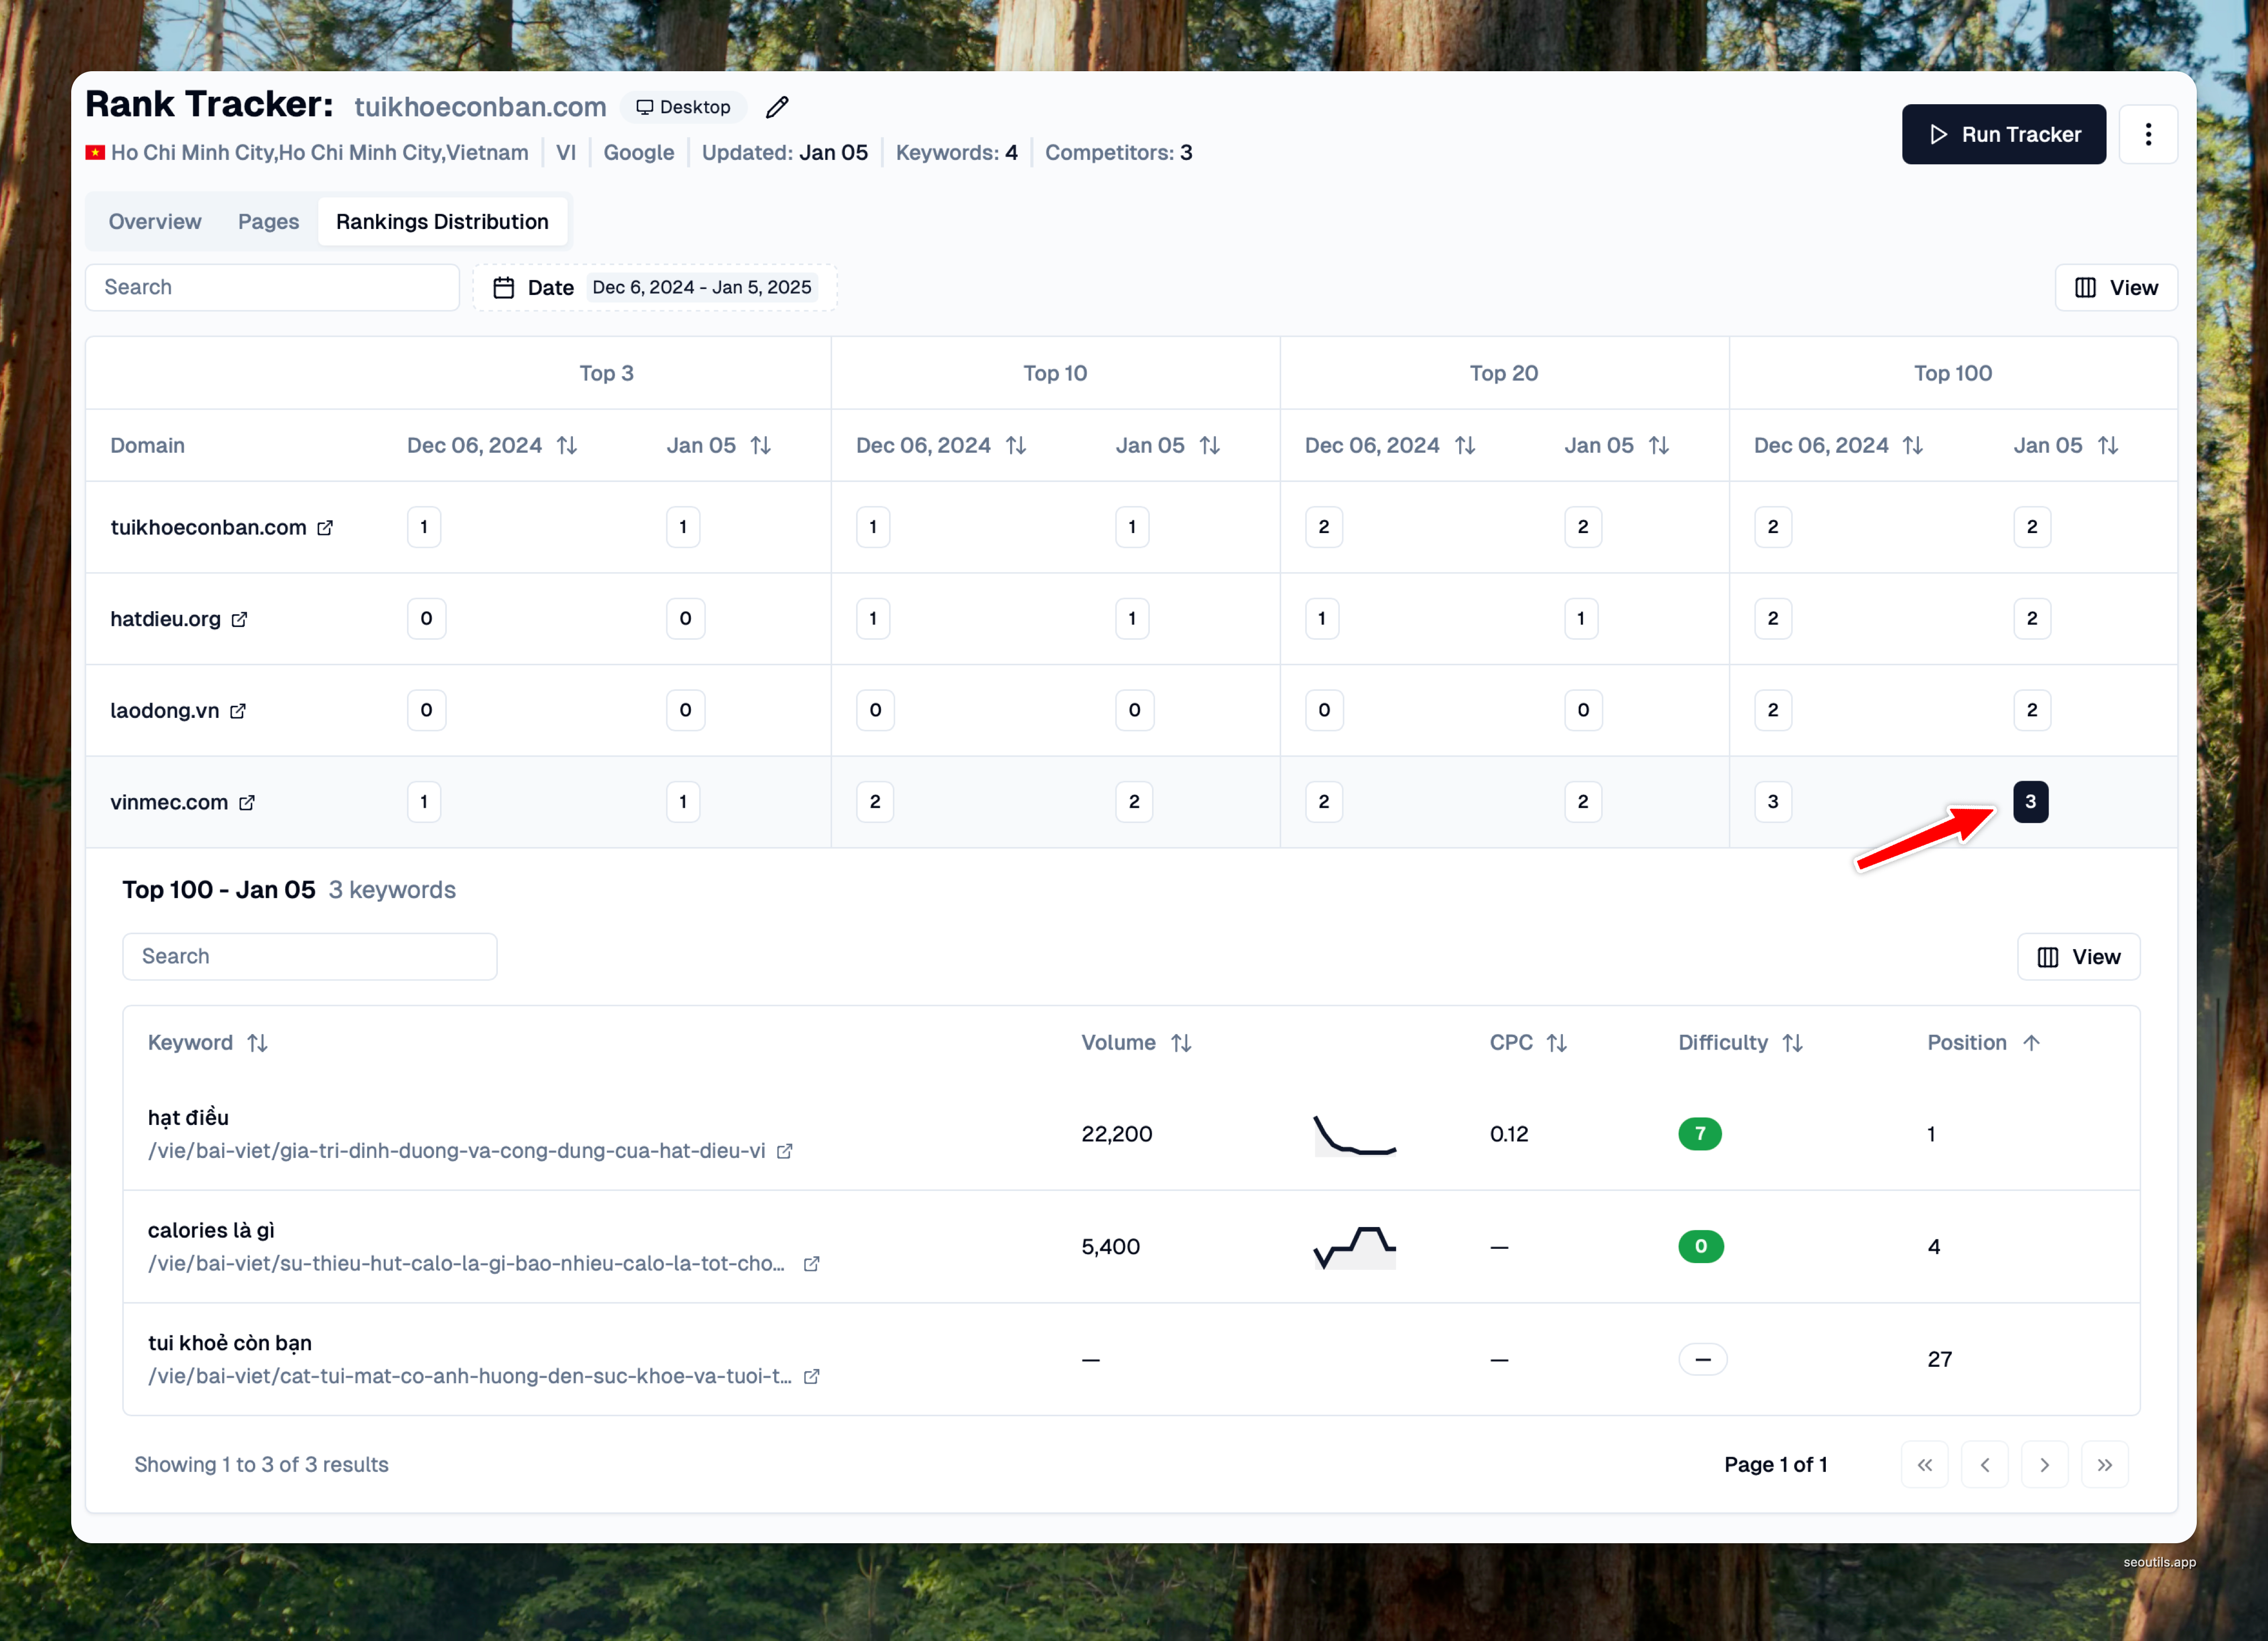
You can click on the total number of keywords to see which keywords are ranking.

Competitors Discovery Tab
In v1.26.3, SEO Utils introduces a new report: Competitors Discovery. It helps you analyze and compare your competitorsβ search engine rankings.
This guide will walk you through how to read and benefit from the Competition Map (scatter plot) and the detailed table, along with how to use the available filters.
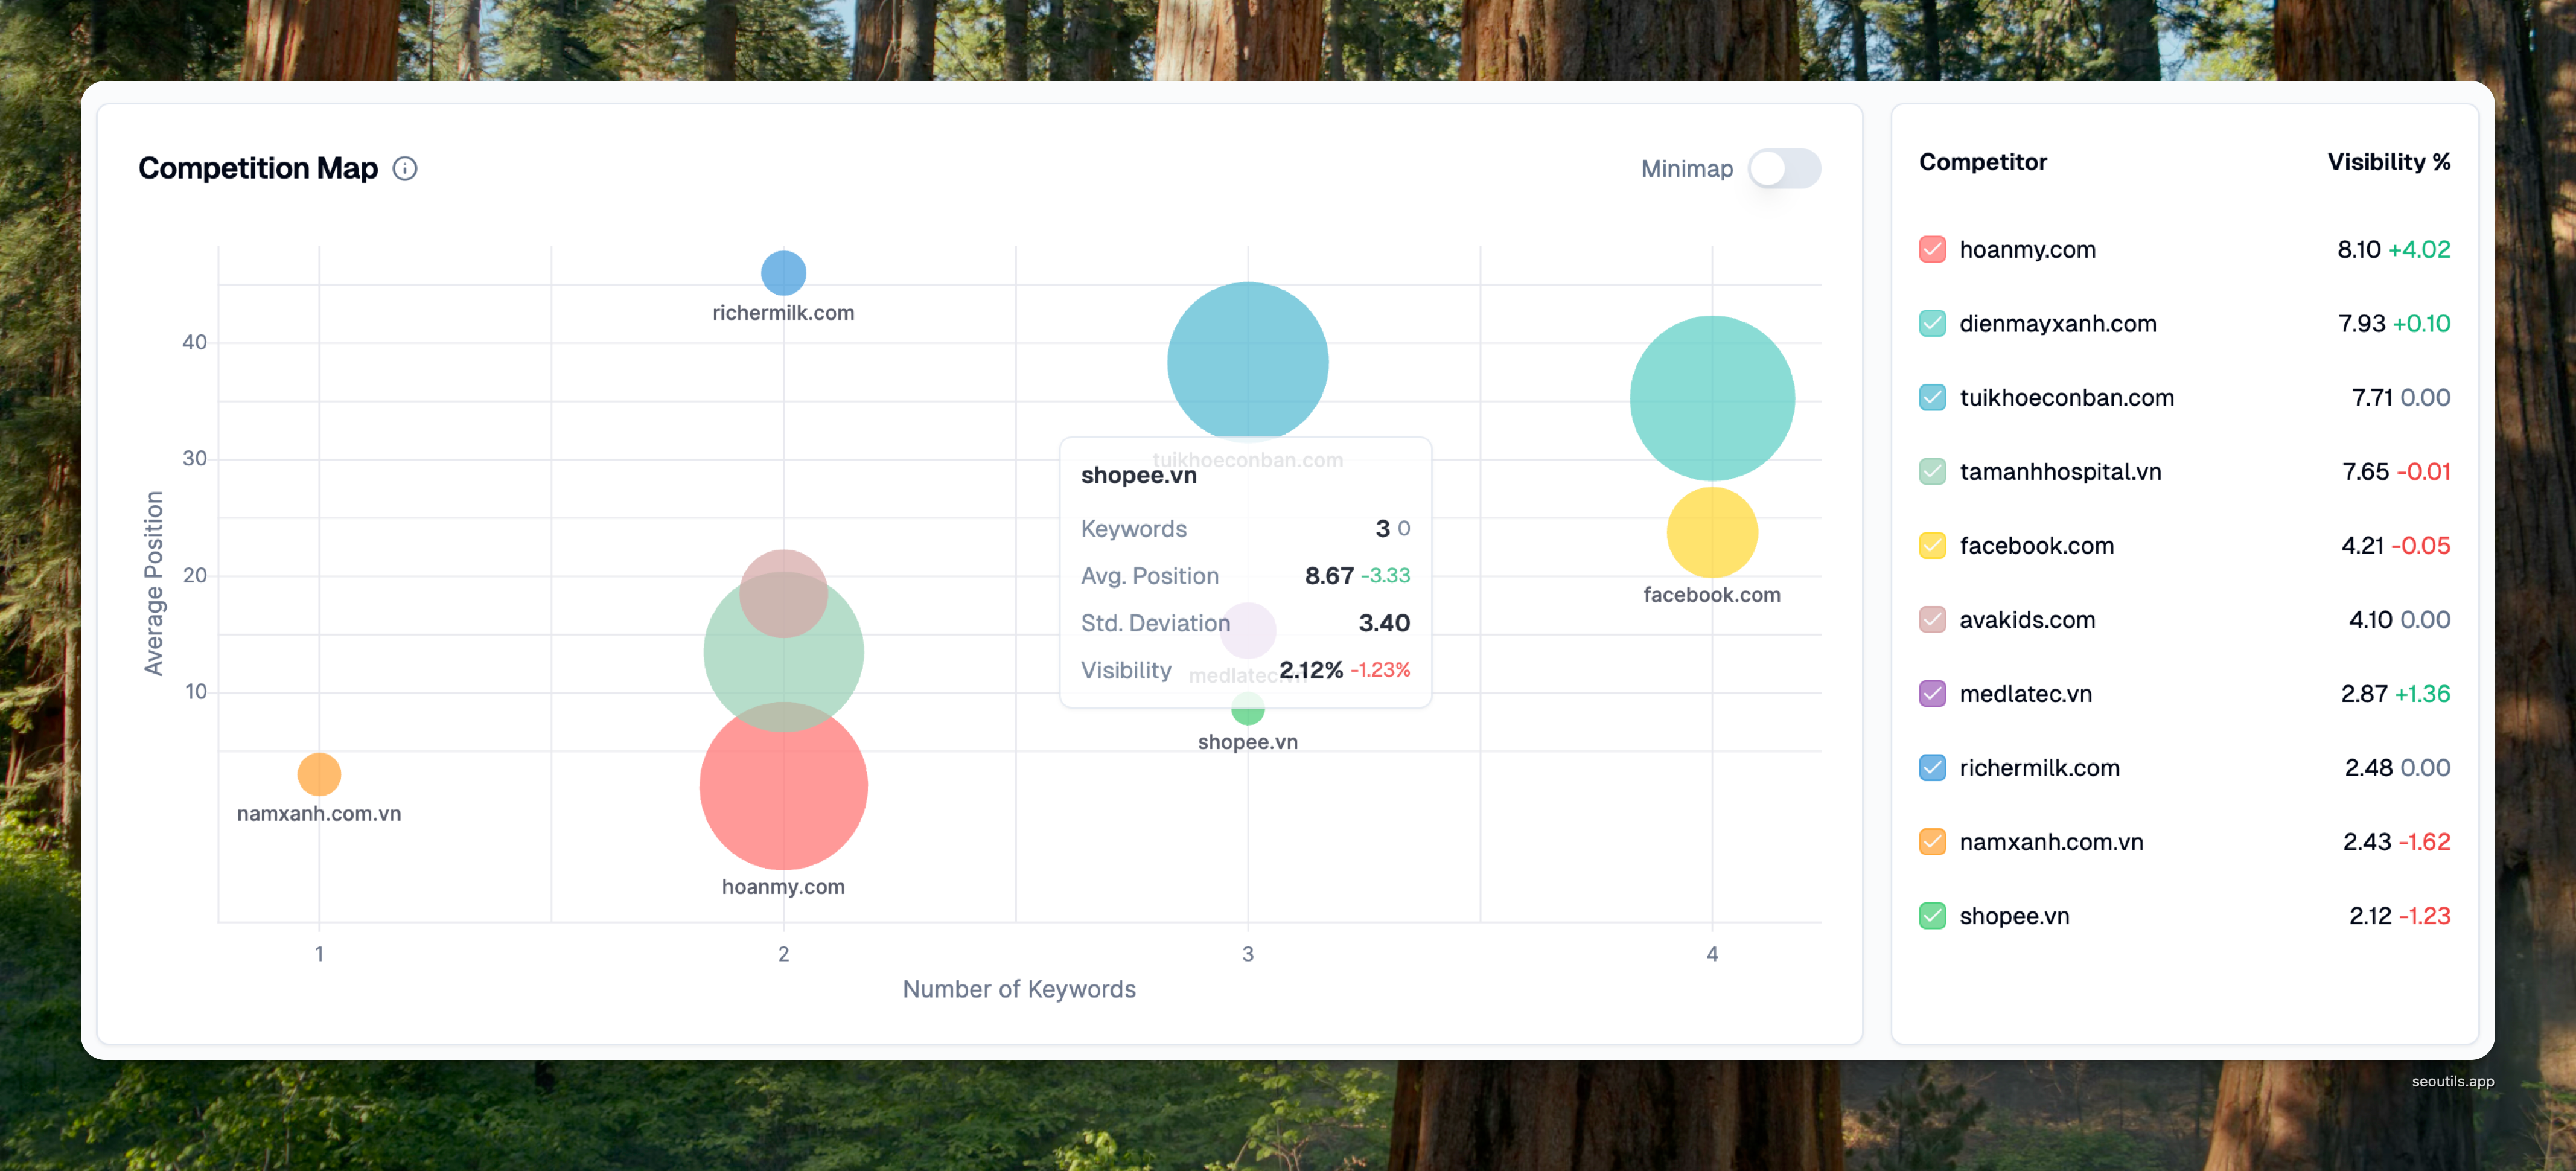
Understanding the Competition Map (Scatter Plot)

What does it show?
The x-axis represents the number of keywords a domain ranks for in Googleβs top 100 search results.
The y-axis represents the average position of a domain across all its ranked keywords.
The size of each bubble represents the visibility of the domain. A larger bubble indicates higher visibility.
The color represents different competitor domains for easy differentiation.
How to read it?
Bottom-right corner (low average position & high keyword count) β This means a domain ranks for many keywords and is performing well (closer to position #1).
Top-left corner (high average position & low keyword count) β This means a domain ranks for fewer keywords and is performing poorly.
Large bubbles β These indicate competitors with strong visibility across many keywords.
Small bubbles β These competitors have a lower presence in SERPs.
Overlapping bubbles β Multiple domains competing for similar keywords.
Key benefits of the scatter plot
Identify strong competitors β Look for large bubbles with low average positions.
Spot market gaps β Find competitors ranking for fewer keywords but with high visibility.
Assess keyword competition β See who dominates a niche by ranking for many keywords.
Tips:
Minimap Toggle: Enables zooming for a closer view.
Hovering Over a Bubble: Displays a tooltip with details about that domain, including: Number of keywords, Average ranking position, Standard deviation, Visibility percentage & change over time.
Understanding the Detailed Competitor Table

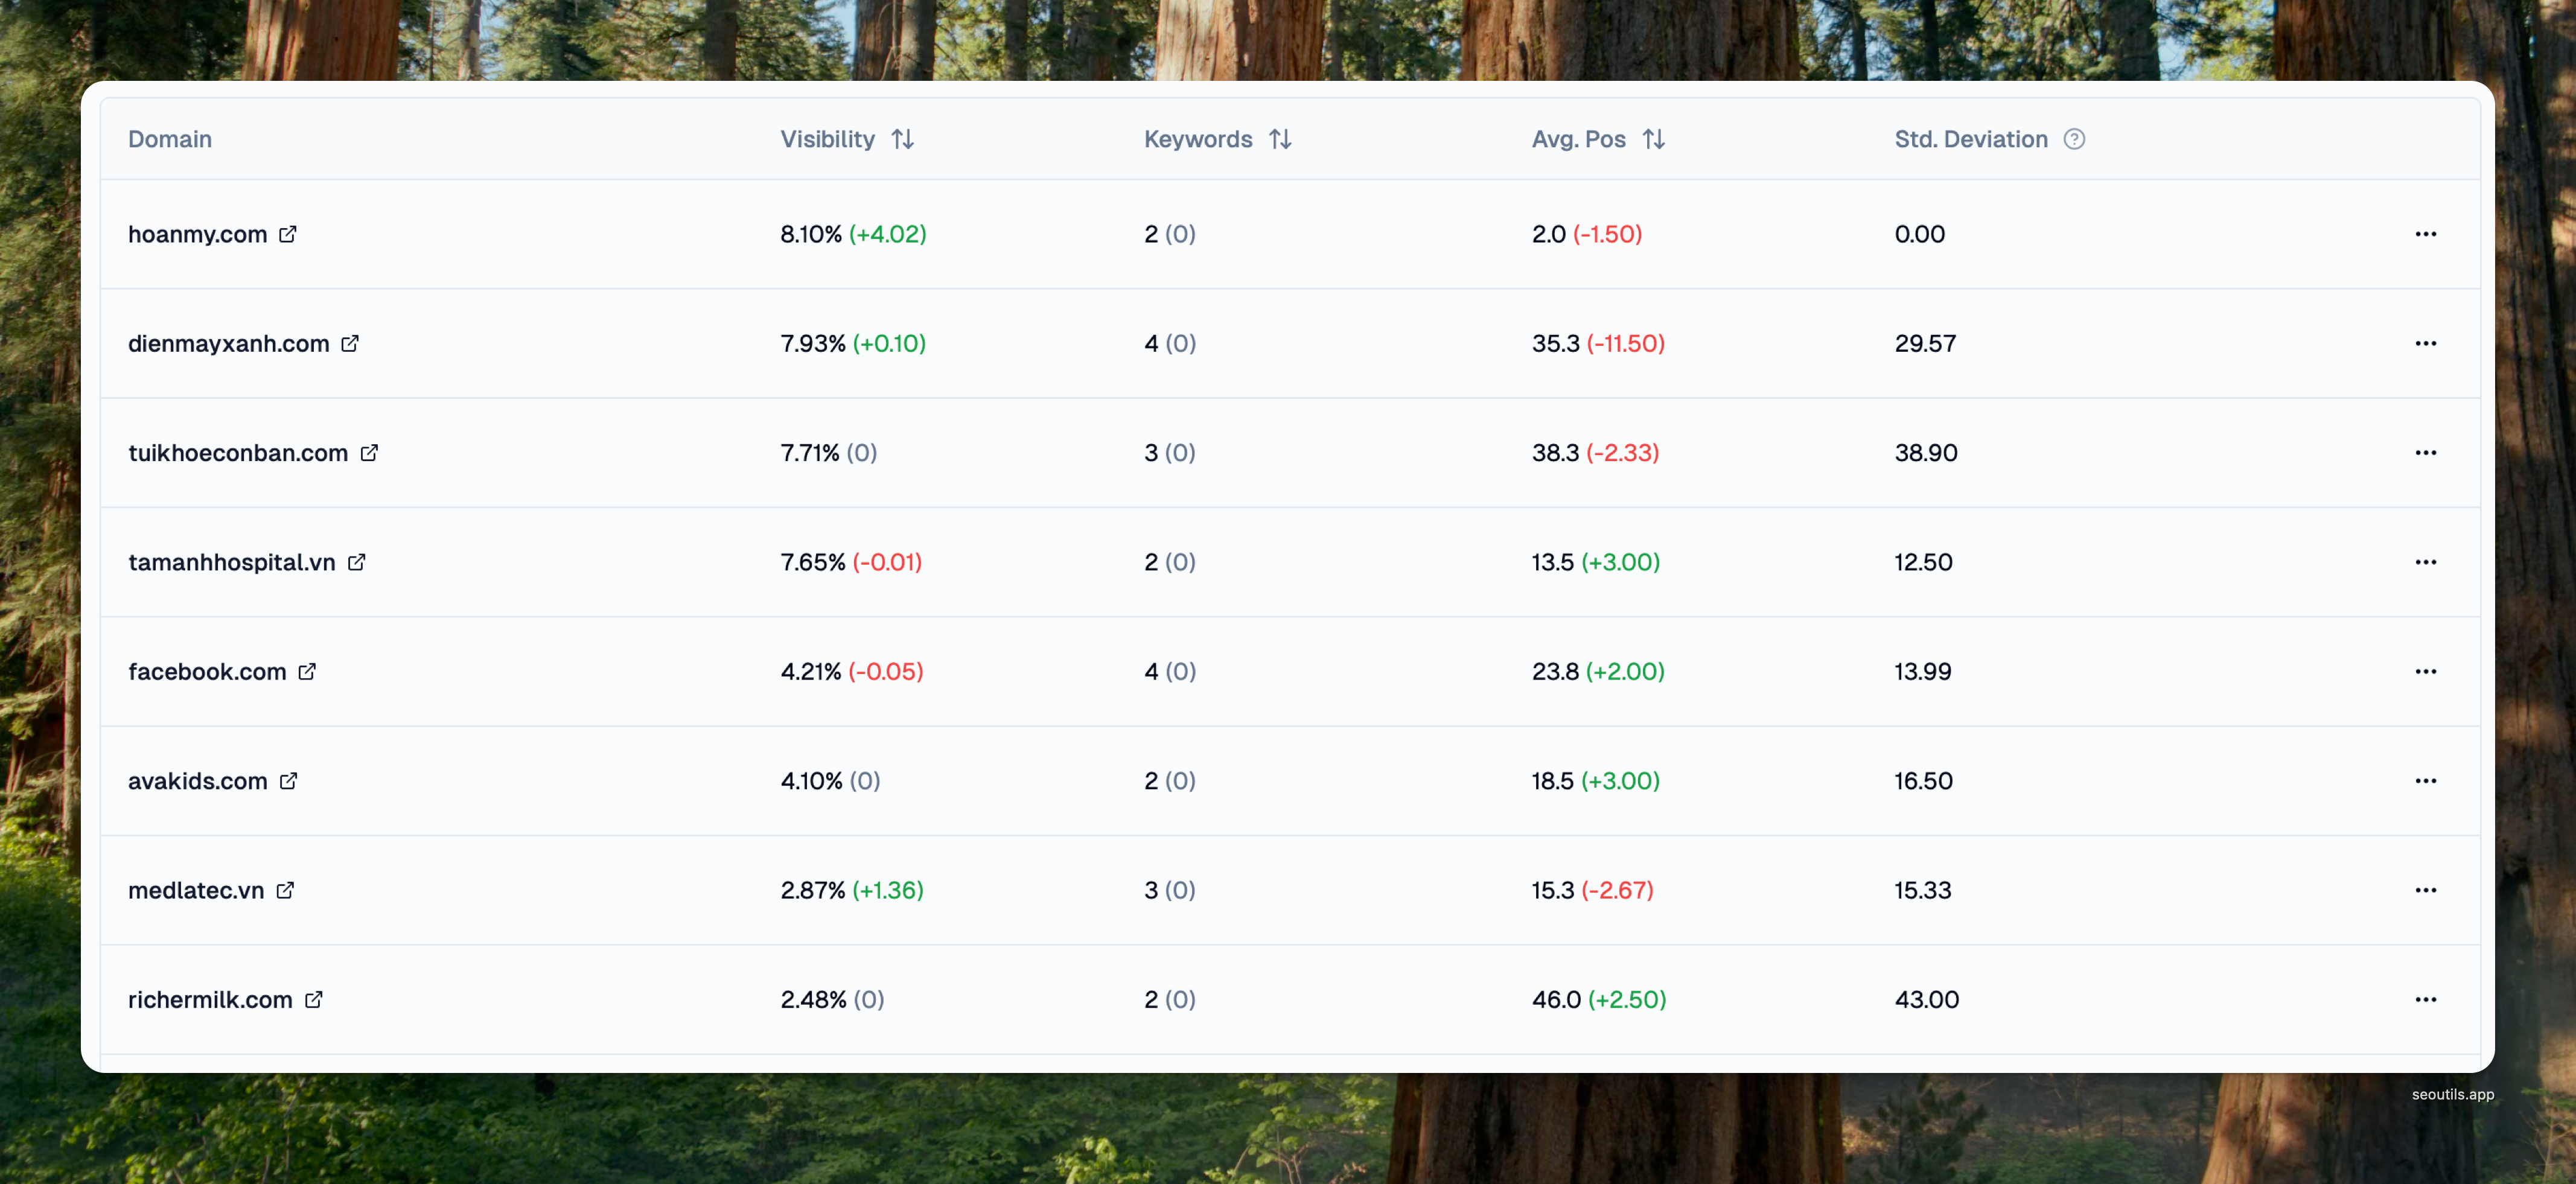
The table provides more specific metrics for each domain, helping you analyze competitor trends in depth.
Domain
The competitorβs website
Visibility
A percentage representing how visible the domain is in search results. Higher visibility means better rankings across keywords.
Keywords
The number of keywords the domain ranks for in the top 100.
Avg. Position
The average ranking position of all ranked keywords for the domain. A lower number means better rankings.
Std. Deviation
Measures the variation of ranking positions. A low value indicates stable rankings, while a high value suggests fluctuations.
Tips:
Sort the columns by clicking on the headers to rank competitors by Visibility, Keywords, or Average Position.
Compare visibility changes to see which domains are gaining or losing ranking positions over time.
Check standard deviation to determine ranking stabilityβdomains with a low Std. Deviation have consistent rankings.
Using Filters for a More Targeted Analysis
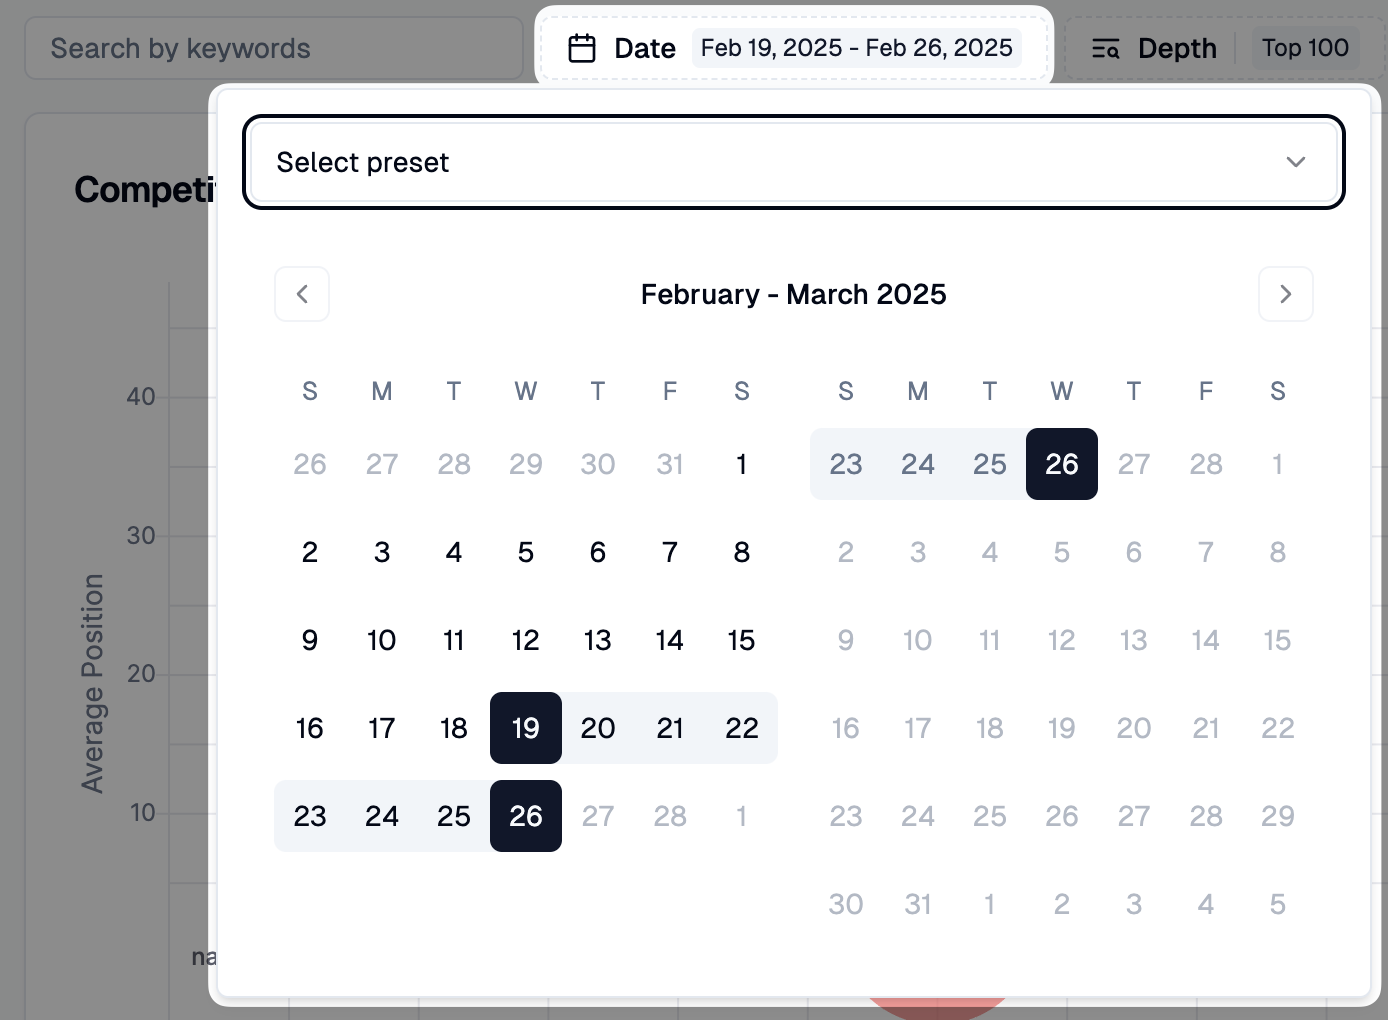
Date Filter

Compare ranking changes over two specific dates.
Useful for tracking ranking trends over time.
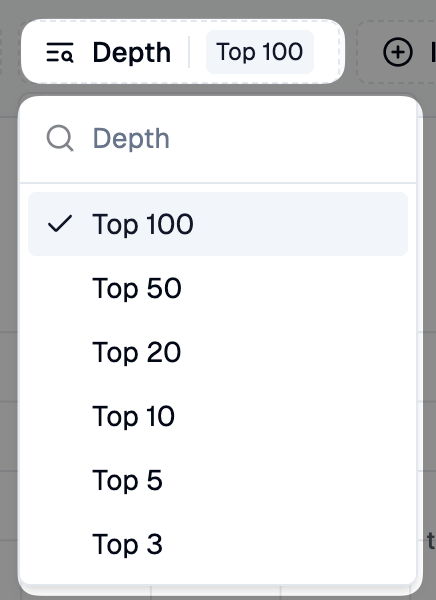
Depth Filter

Select Top 100, Top 50, Top 20, Top 10, Top 5, or Top 3 domains.
Helps you analyze only the most relevant competitors in SERPs.
Use Case: If you want to focus on high-ranking competitors, select Top 10 or Top 5.
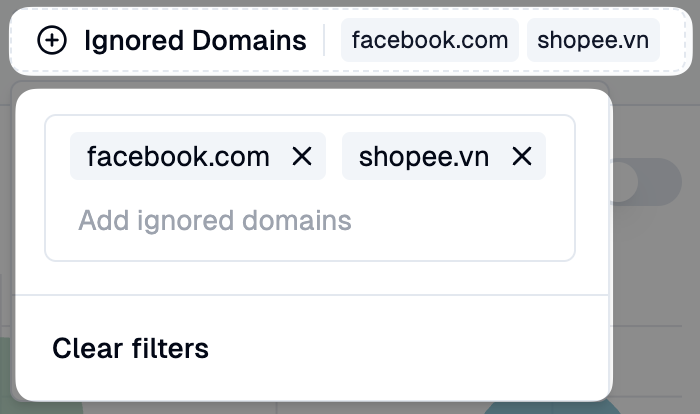
Ignored Domains Filter

Exclude specific competitors that may not be relevant (e.g., social media sites like Facebook or large aggregators).
Use Case: If a competitor dominates rankings but isnβt a direct competitor, excluding them gives clearer insights into your true competitors.
You can also filter the data by searching for a specific keyword, allowing you to analyze rankings and competition for that keyword alone.
Keyword Fluctuation Tab
The Keyword Fluctuation tab helps you track how your keyword rankings have changed over time. Unlike the Overview tab which compares two specific dates, this tab shows ranking changes across multiple time periods at a glance.

Understanding the Columns
Keyword
The tracked keyword with tags
Intent
Search intent classification (I=Informational, N=Navigational, C=Commercial, T=Transactional)
Start
The earliest ranking position within the selected date range
Rank
Current ranking position at the end of the date range
SF
Number of SERP features appearing for this keyword
1d
Ranking change compared to 1 day ago
7d
Ranking change compared to 7 days ago
30d
Ranking change compared to 30 days ago
Life
Lifetime change (difference between Start and current Rank)
URL
The ranking page URL
Reading the change columns:
Green numbers indicate ranking improvements (moved up in search results)
Red numbers indicate ranking declines (moved down)
0 means no change in position
β means data is not available (keyword wasn't ranked on that date)
Use Cases for Keyword Fluctuation
Monitor stability: Keywords showing 0 across all time periods have stable rankings
Identify quick wins: Look for keywords with positive 7d/30d changes to understand what's working
Spot problems early: Negative changes in recent periods (1d, 7d) may indicate issues to address
Track Local Pack: Keywords with πΊοΈ map pin icons are ranking in Google's Local Pack
Insights Tab
The Insights tab automatically analyzes your keyword ranking data and classifies keywords into actionable categories. It helps you identify which keywords need attention and why β without manually scanning through hundreds of rows.

Insights are computed automatically after each snapshot completes. You don't need to trigger them manually.
Summary Cards
The tab displays summary cards, each representing a different insight type:
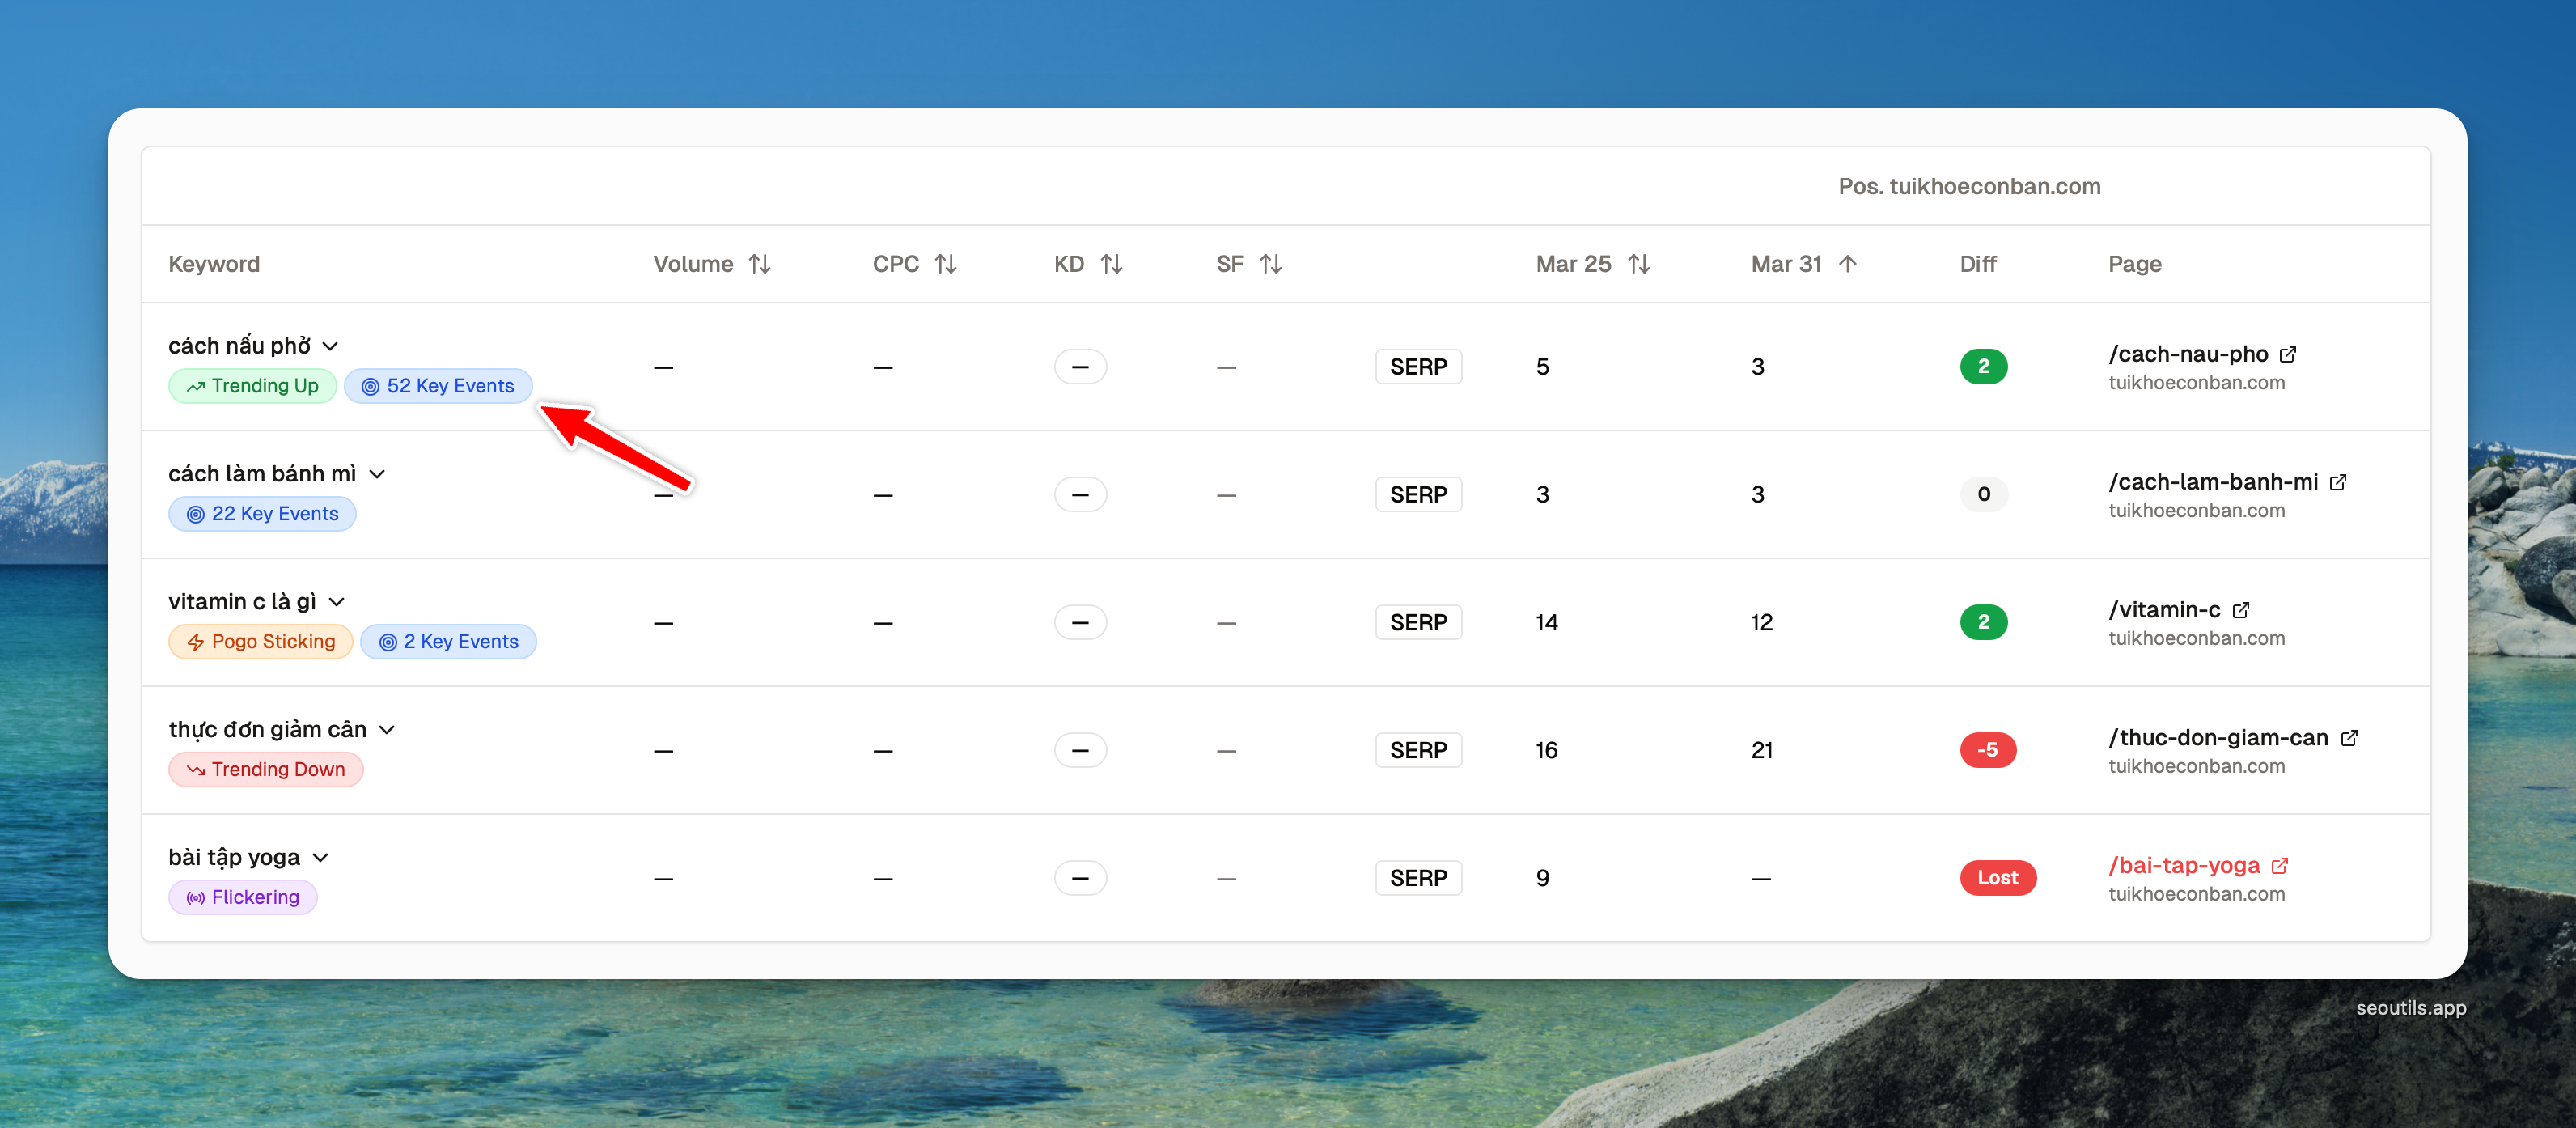
Trending Up
Green
Keywords with a statistically significant upward ranking trend over the configured window
Trending Down
Red
Keywords with a statistically significant downward ranking trend
Pogo Sticking
Orange
Keywords with unstable rankings that oscillate back and forth significantly
Flickering
Purple
Keywords that repeatedly appear and disappear from search results
Key Events
Blue
Keywords associated with pages that generated conversions in Google Analytics 4
PAA Source
Purple
Keywords where your target domain currently appears as a source inside the People Also Ask box. Requires PAA Click Depth to be enabled on the report.
Click any card to see the matching keywords in a table directly below the cards. The selected card is highlighted, and you can switch between insight types by clicking different cards. Your selection is remembered across sessions.
A subtitle above the cards shows the date range used for calculations: "Insights calculated from your last 14 snapshots (Mar 13 β Mar 26)". You can adjust the number of snapshots using the dropdown β options range from 7 to 90 days.
Enabling Key Events: Connect your Google Analytics 4 property to see which keywords drive conversions. SEO Utils matches keywords to landing pages using your rank tracker's position data. If you also have Google Search Console connected, attribution accuracy improves β GSC provides Google's actual click data showing which keyword led to which page.
Keyword Table
When you click a summary card, a keyword table appears showing:
Keyword β with insight badges displayed inline
Start Position β position at the beginning of the rolling window
Current Position β position at the end of the rolling window
Diff β position change over the window
Page β the ranking URL
You can expand any keyword row to view its position history chart with trend lines and conversion bars.

Inline Badges in Overview
Keywords with active insights also display colored badges in the Overview tab β next to existing tags. These badges are read-only indicators that help you spot insights while browsing the full keyword table.

Chart Overlays
When you expand a keyword row to view its position history chart, additional overlay controls appear if that keyword has insights:
Show Trend Line β Toggle a dashed regression line across the chart. Green for trending up, red for trending down.
Highlight Swings β Toggle orange markers on the specific data points that triggered pogo sticking detection.
Key Events Bars β When GA4 conversion data exists, subtle blue bars appear at the bottom of the chart on days that had conversions. These are always visible (no toggle needed) and show the event count in the tooltip.

How Insight Detection Works
Trend Detection uses linear regression with an RΒ² safety net to distinguish real trends from noise. It applies tiered thresholds β small ranking changes on page 1 are significant, while the same change on page 5 is noise.
Pogo Sticking detects keywords with 2 or more significant opposing position swings within a 14-day window. The swing threshold scales by position tier (3+ positions for top 10, 5+ for positions 11-30, 10+ for positions 31-100).
Flickering counts state transitions between ranked and not-ranked. Keywords with 3 or more transitions in 14 days are flagged β this indicates indexation instability, not ranking competition. For reports with a shallow tracking depth (under 50), SEO Utils automatically excludes transitions where the keyword was near the depth boundary β preventing false positives from keywords that simply bounce in and out of your configured tracking range.
PAA Source is a binary current-state signal β only the most recent snapshot matters. The card count reflects "your target domain is in PAA right now" rather than "was in PAA at some point recently". Activation and resolution events fire the day you appear in or disappear from a PAA box, giving precise gained/lost alerts via Automations.
Requirements for Each Insight Type
Trending Up/Down β Requires a minimum number of snapshots (at least 50% of the configured trend window, minimum 7). Available for all report frequencies.
Pogo Sticking & Flickering β Require daily tracking. These insights are locked for weekly or monthly reports because the data between snapshots is invisible. A notice appears on locked cards. For the most accurate flickering detection, use a tracking depth of 100. Shallow depths (10-30) may miss some genuine flickering because keywords near the depth boundary are automatically excluded to prevent false positives.
Key Events β Requires Google Analytics 4. Connect a GA4 property and map it to the same domain as your rank tracker report. Optionally connect Google Search Console for more accurate keyword-to-page attribution. Available for all report frequencies.
PAA Source β Requires PAA Click Depth β₯ 1 on the report (DataForSEO only). The card is locked otherwise, with a hint to enable the setting. Available for all report frequencies.
Insights Readiness Checklist
Use this table to check which insights are available for your report:
Trending Up/Down
Any
7+ (or 50% of trend window)
Any
Not needed
Not needed
β
Pogo Sticking
Daily (1 day)
7+
Any (100 recommended)
Not needed
Not needed
β
Flickering
Daily (1 day)
2+
Any (100 recommended for best accuracy)
Not needed
Not needed
β
Key Events
Any
Any
Any
Required
Optional (improves accuracy)
β
PAA Source
Any
1+
Any
Not needed
Not needed
PAA Click Depth β₯ 1 (DataForSEO only)
To check your report's settings, open the report and look at the schedule frequency (daily/weekly/on-demand), tracking depth, and snapshot count. If Pogo Sticking or Flickering cards show as locked, switch your report schedule to daily.
Configuring the Trend Window
The trend detection window defaults to 14 days. You can adjust it directly on the Insights tab using the dropdown in the subtitle area (e.g., "Insights calculated from your last [14 βΎ] snapshots"). When you change the value, insights are automatically recomputed in the background. A longer window (e.g., 30 days) catches slower trends but requires more snapshots before badges appear.
Insights in Exported Reports
When you export a rank tracker report as PDF or HTML, insight badges are included in the keyword table. Each badge uses inline styling, so they render correctly in emails, PDFs, and shared links without requiring JavaScript.
Manage Organic Rank Tracker Reports
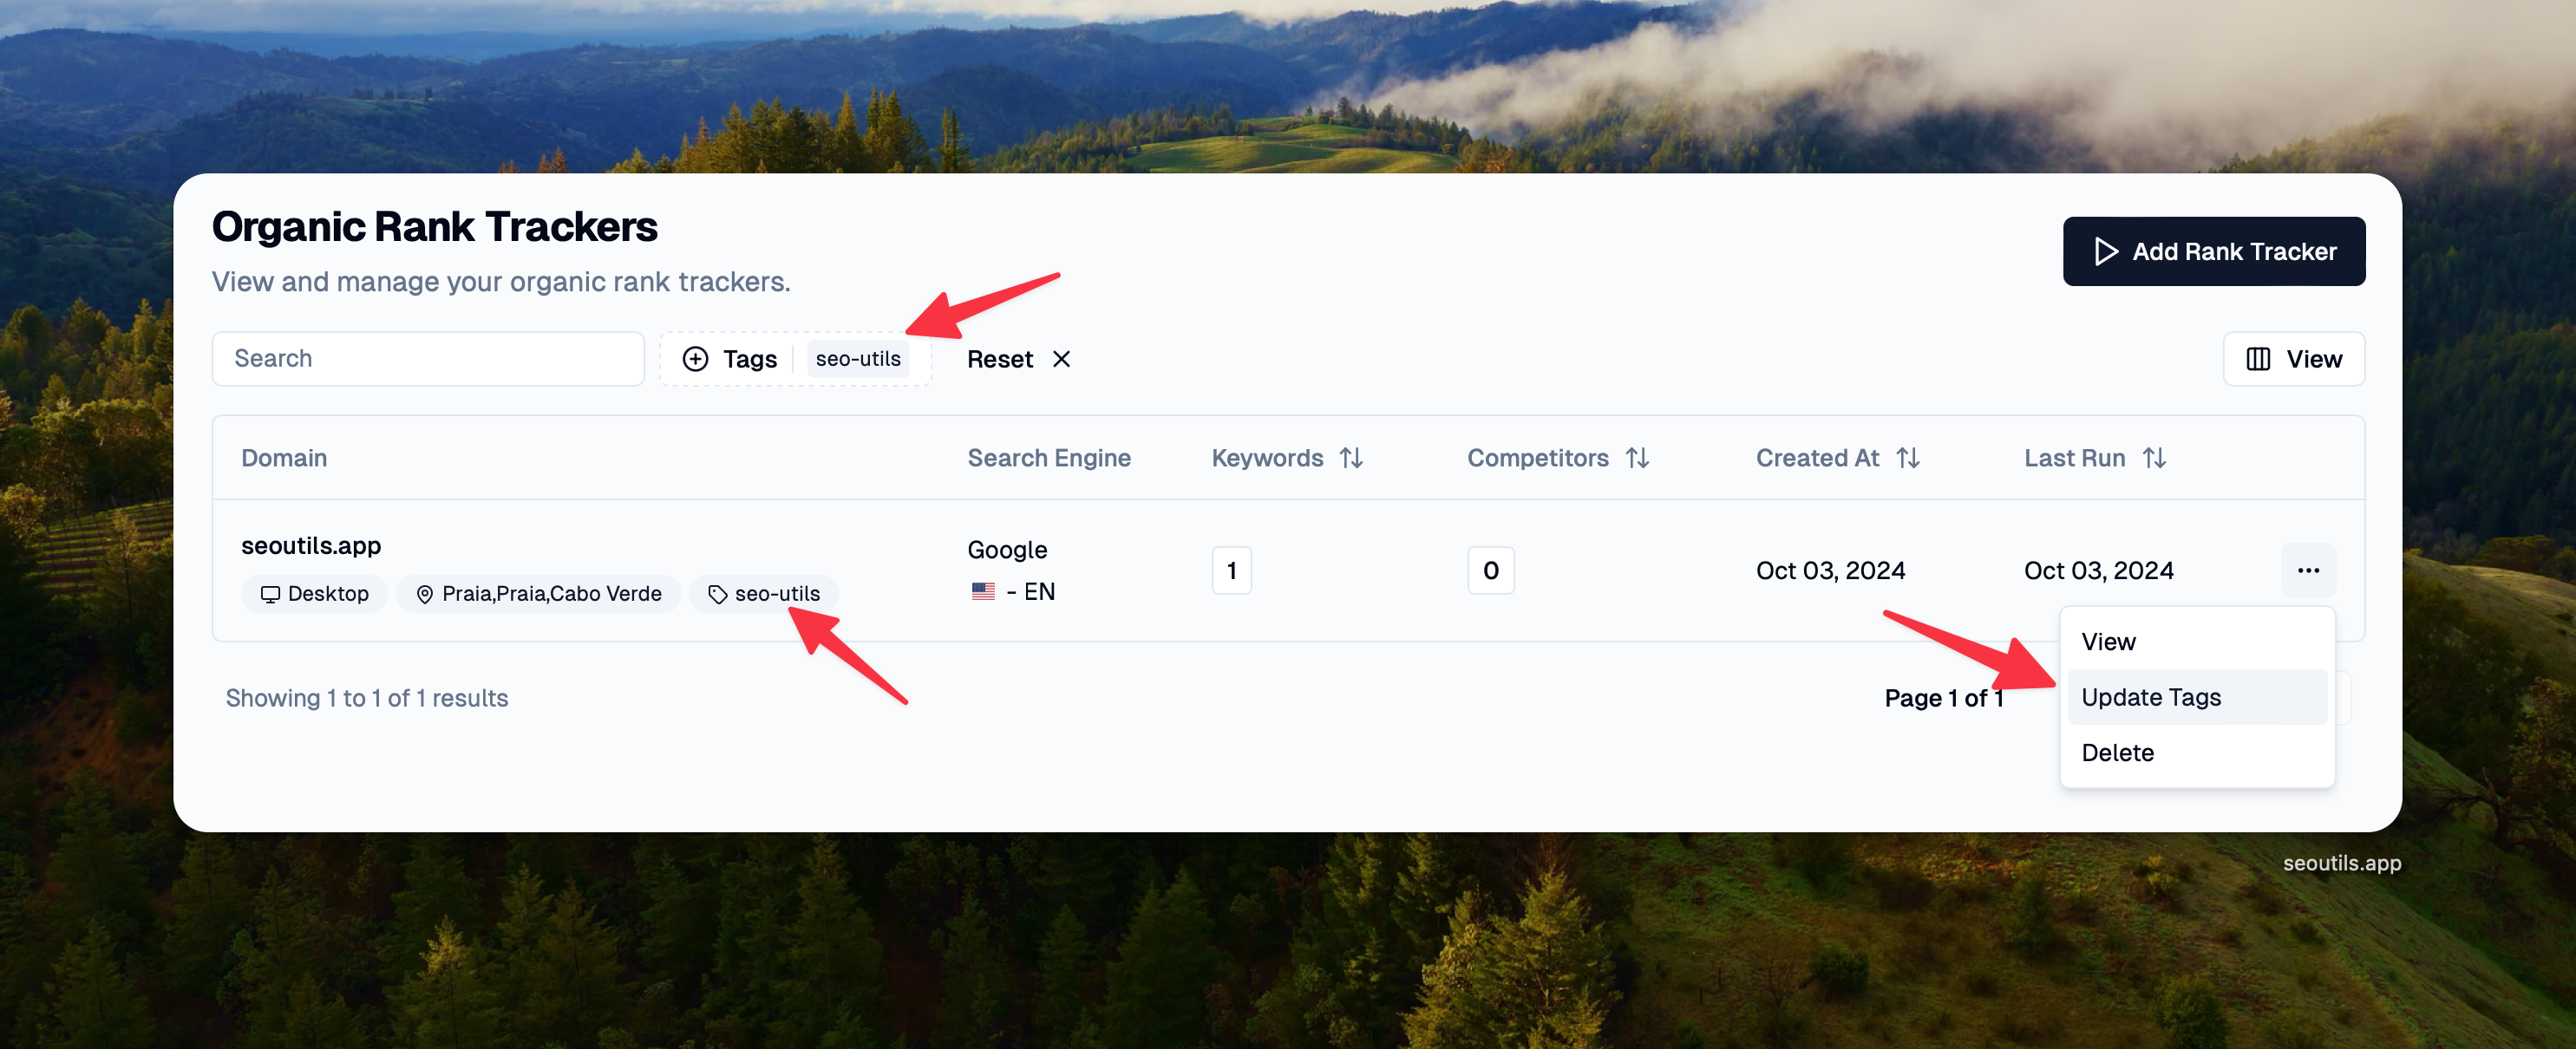
You can add tags to your Organic Rank Tracker reports and filter by those tags.
This will be especially useful if you manage dozens of locations for a single client. You can add the client's name as a tag, and whenever you want to view all reports for that client, you can simply filter by the tag name.

Export Reports
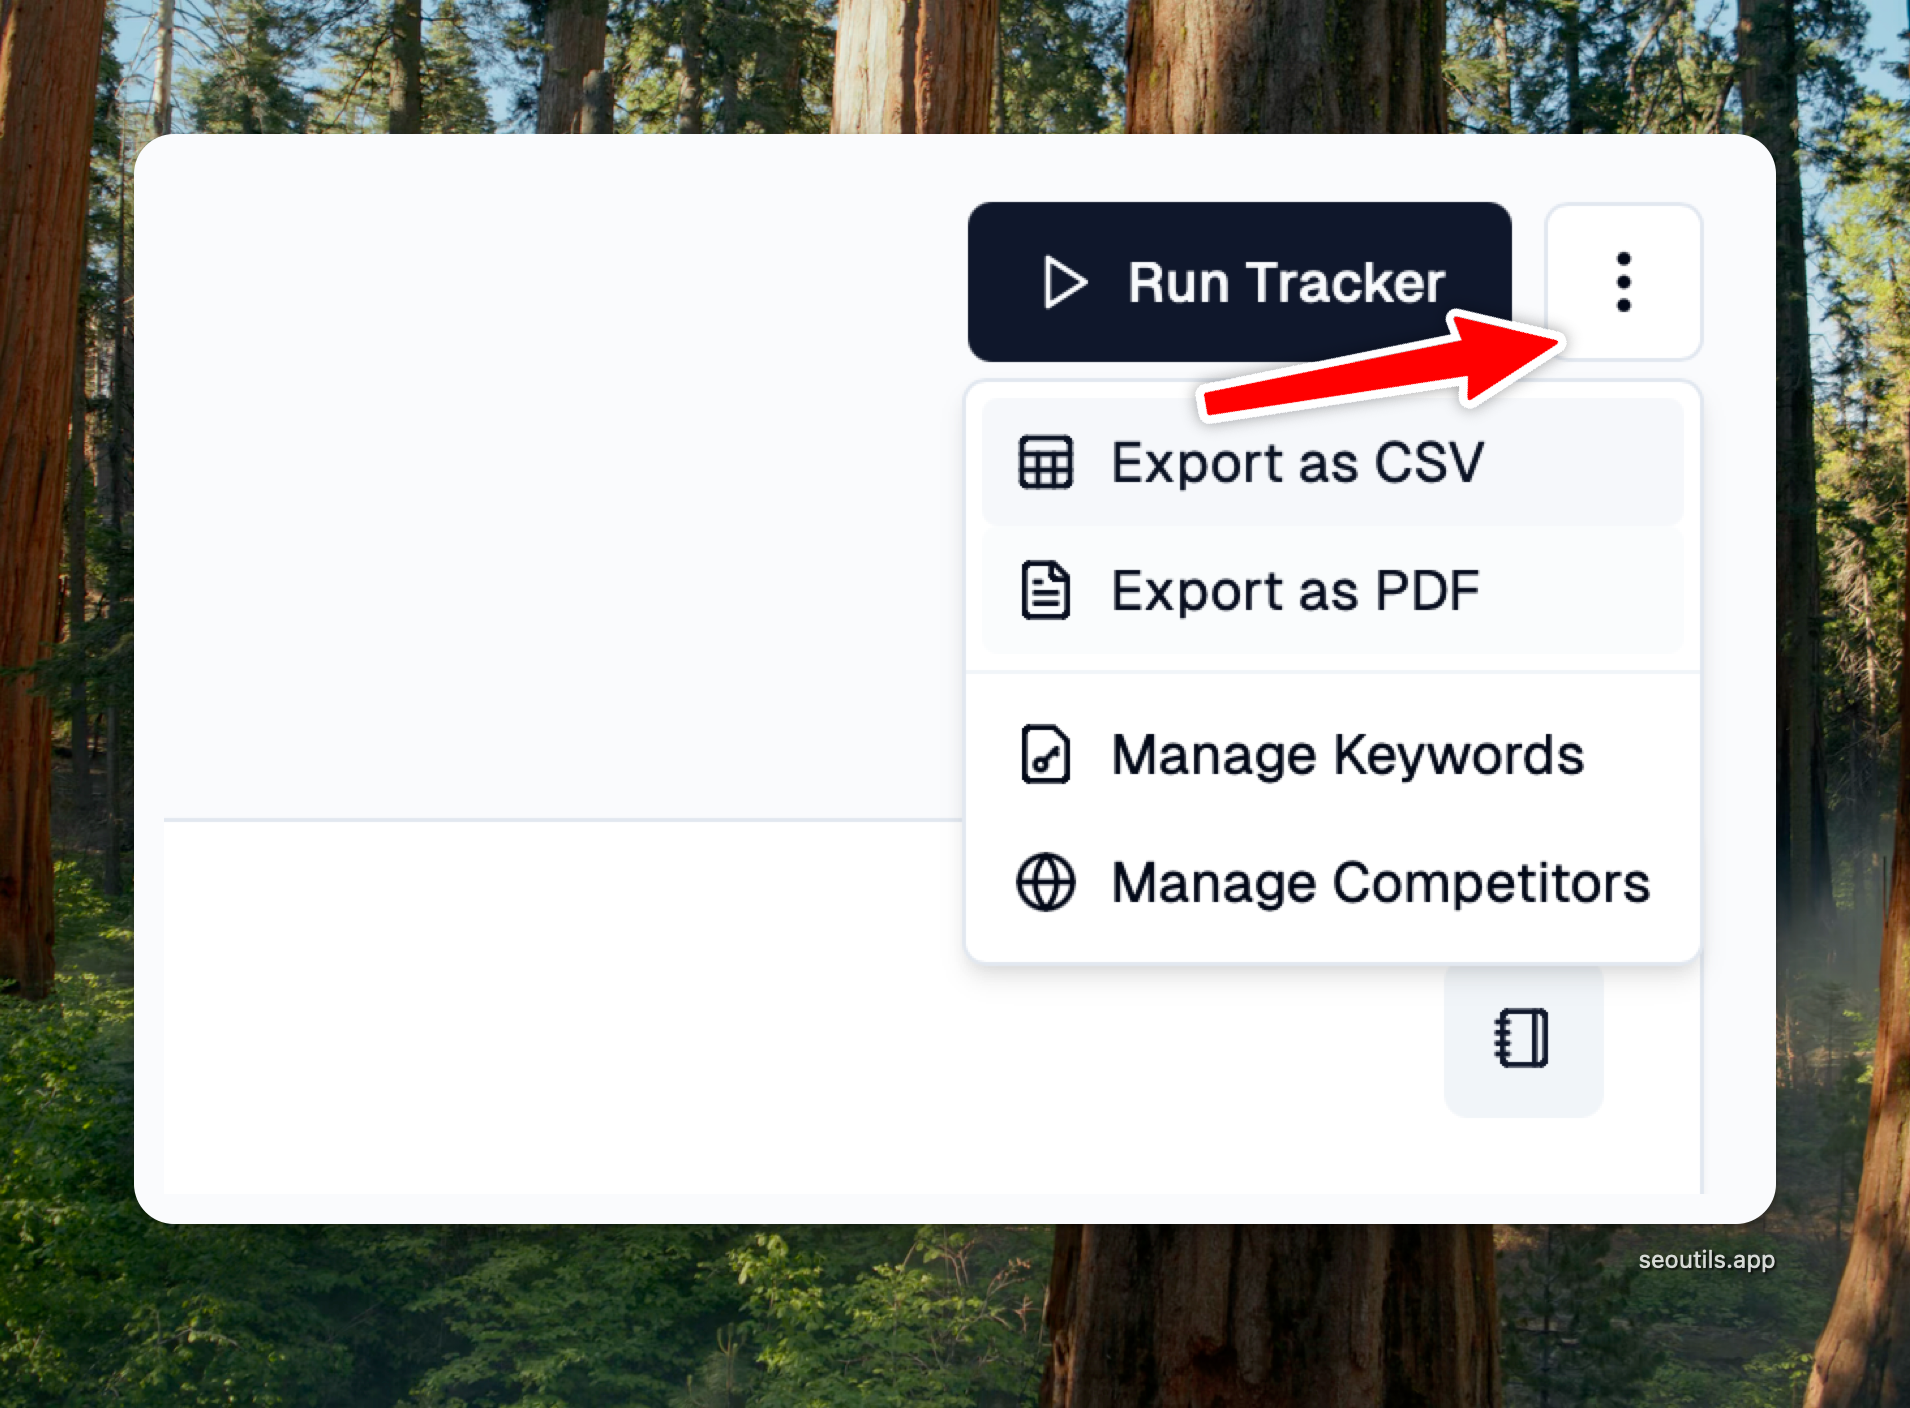
You can export the organic rank tracker report as CSV, PDF, or HTML by clicking the Actions dropdown.

PAA Appearances column β When PAA Click Depth is enabled on the report, the CSV export includes a PAA Appearances column showing how many times each domain appeared as a PAA source within the selected date range. This lets you pivot or filter PAA visibility data externally in Excel, Sheets, or any analytics tool.
Pixels From Top columns β When Track Pixels From Top is enabled on the report, the CSV export includes three additional columns: Pixels From Top [from-date], Pixels From Top [to-date], and Pixels Diff. Use these to analyze on-screen visibility trends outside the app or build custom reports that combine rank and pixel signals.
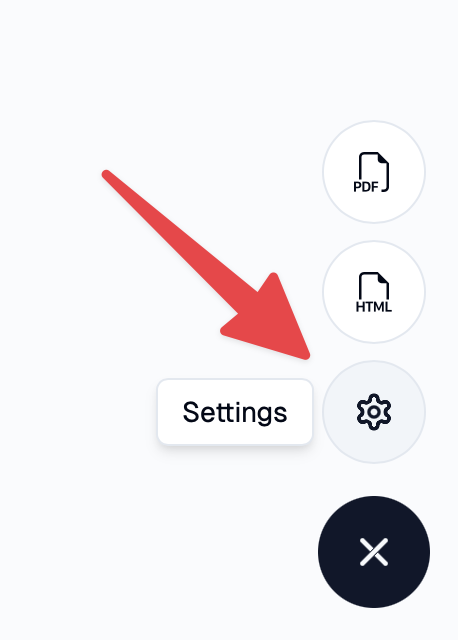
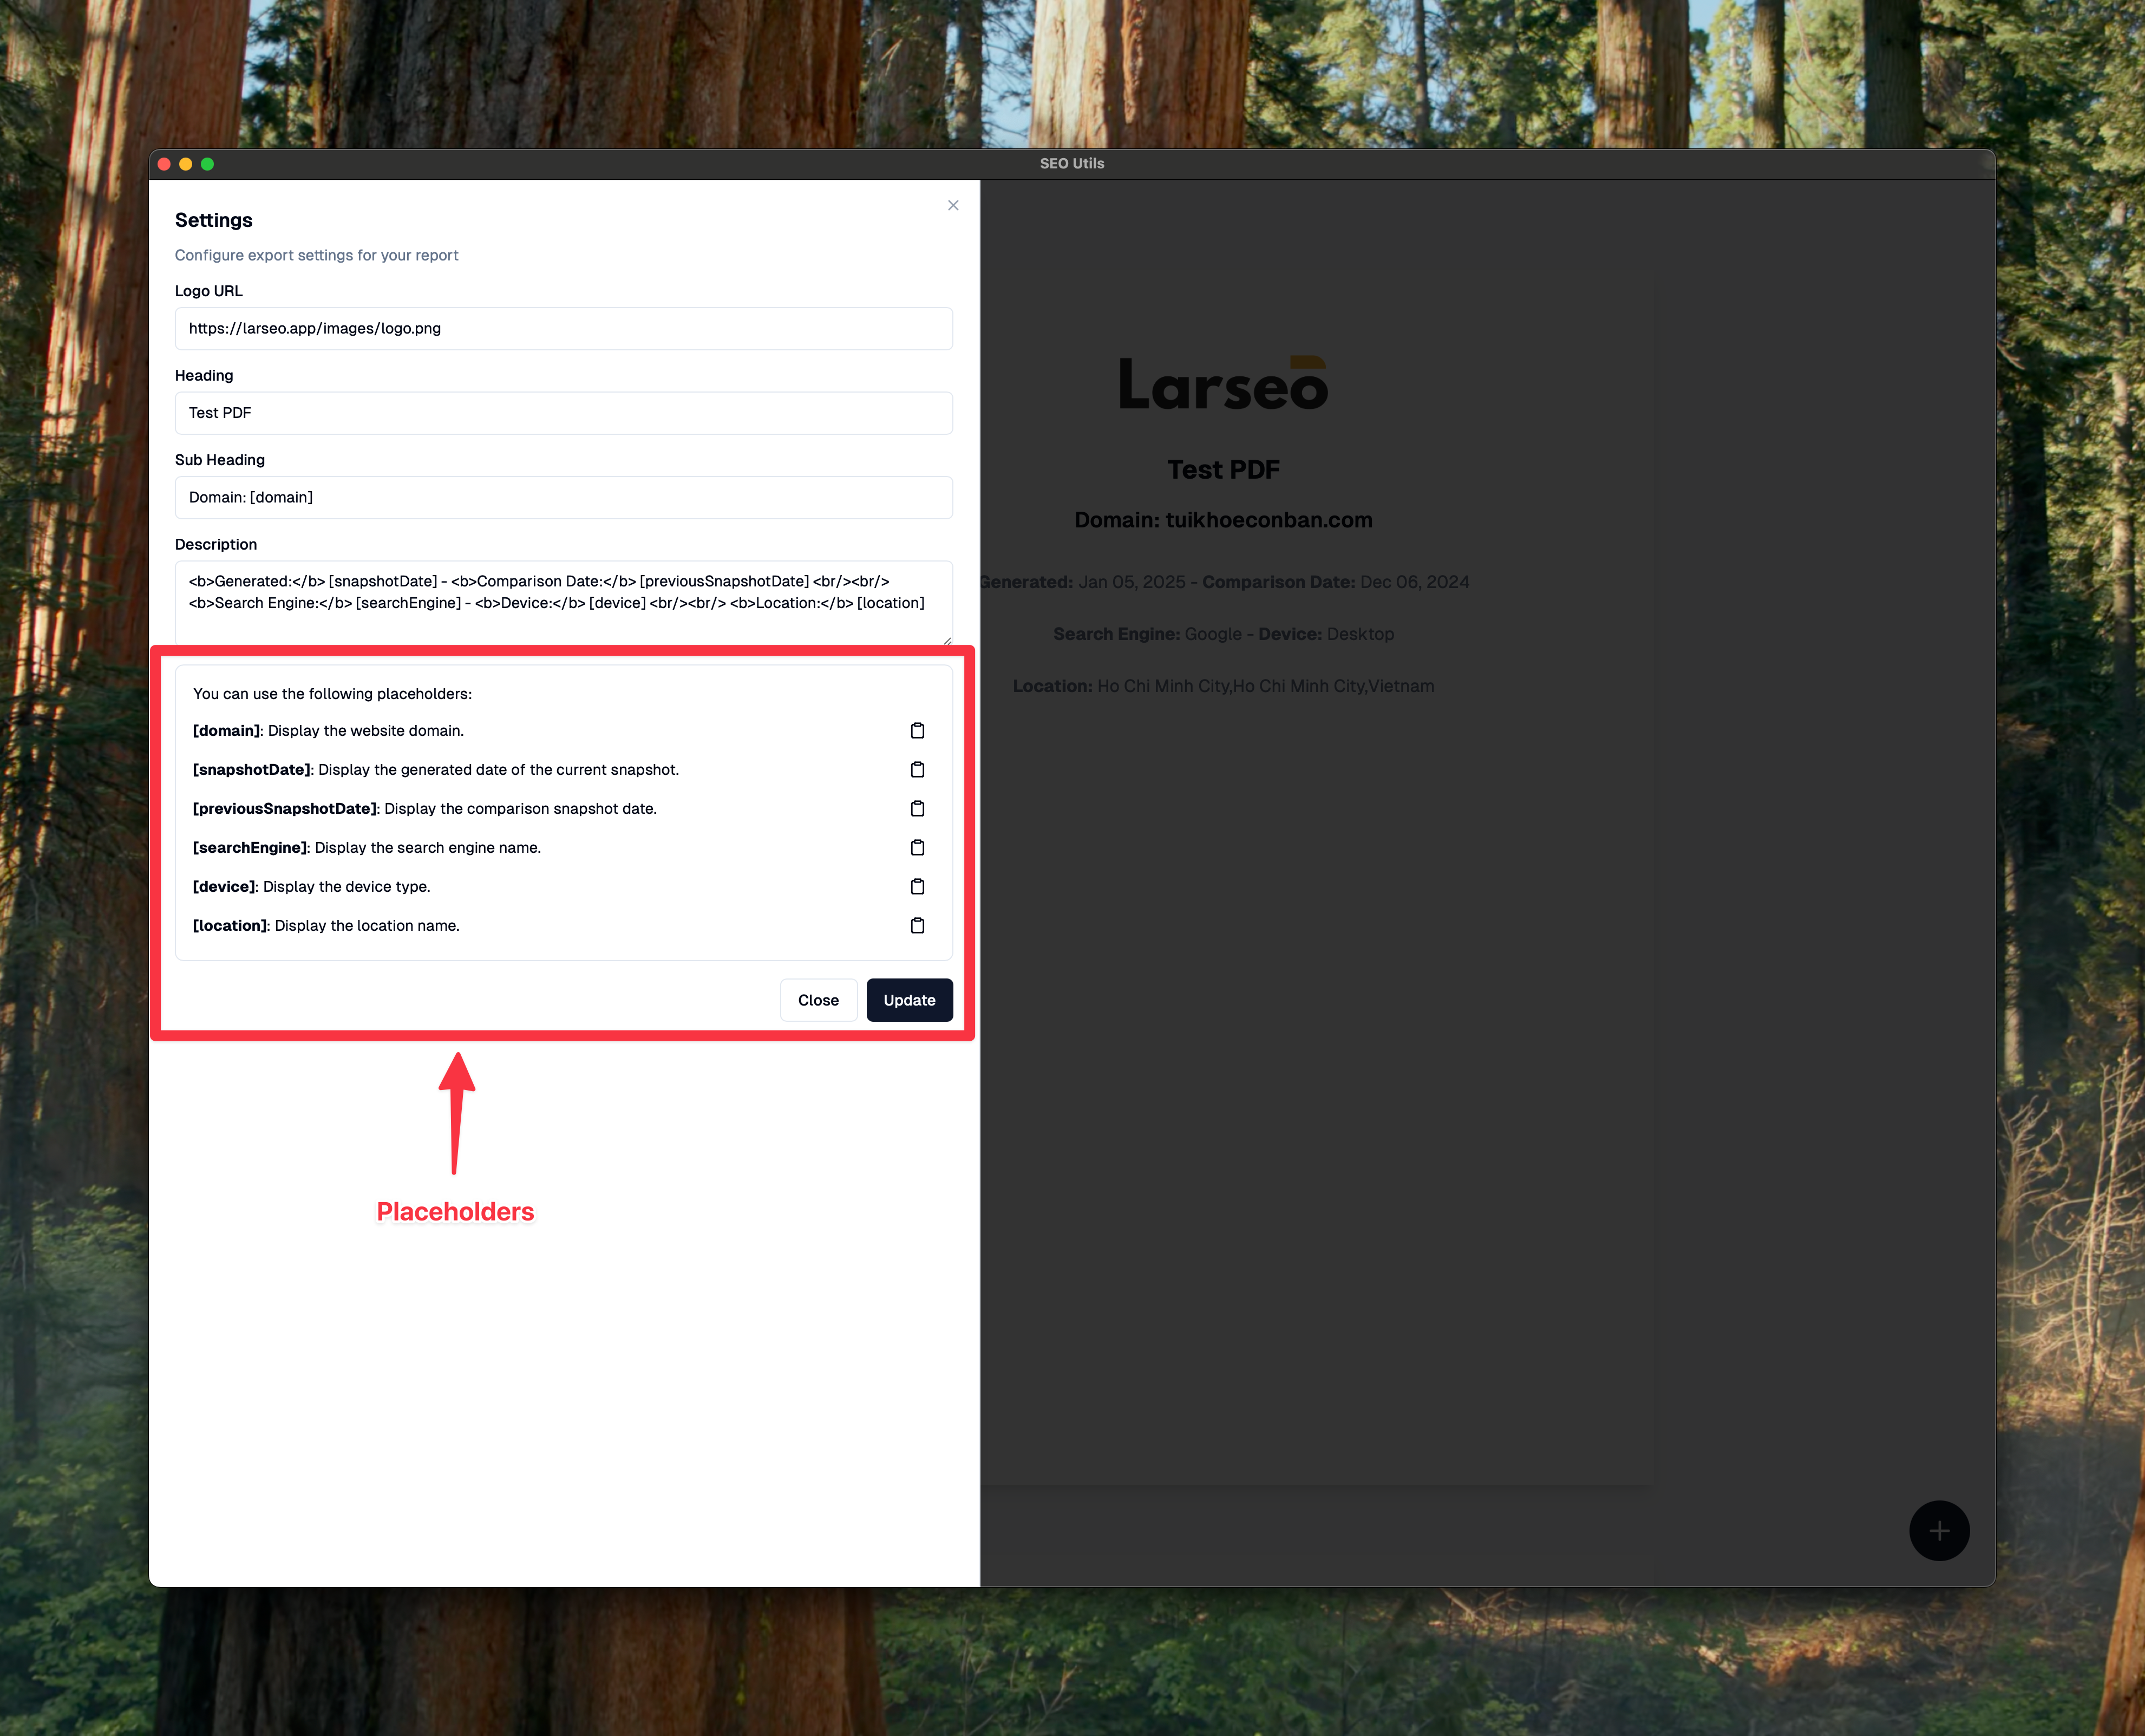
When exporting a report as PDF or HTML, you can personalize the report cover with your own branding by clicking the Settings icon.

You can use placeholders to dynamically replace content in headings, subheadings, or descriptions. For example, if you include the placeholder [domain]in a sub-heading, it will automatically replace it with the target domain of your report.

Last updated